
Deutsch-Chinesische Enzyklopädie, 德汉百科
 Vereinigte Staaten

美国网球公开赛(英语:US Open)是每年度第4项也是最后1项网球大满贯公开赛,通常在8月底至9月初举行,赛事共分为男子单打、女子单打、男子双打、女子双打、男女混合双打五项,并且也有青少年组的比赛。自1978年开始赛事在位于纽约皇后区法拉盛草原公园USTA国家网球中心举行。
| 创办 | 1881年,142年前 |
|---|---|
| 地点 |
美国网球公开赛一共包含了五个单项,即男子单打、女子单打、女子双打、男子双打和混合双打,值得一提的是混合双打是二十世纪初叶时由男子单打表演项目演变而来的。 第一届美国男子网球锦标赛于1881年8月在美国罗得岛的纽波特的娱乐场(Newport Casino)举行,当时只有美国国家网球协会的会员才可以参加,从那时起纽波特作为网球中心连续举办了34年的网球赛。
男子双打的比赛在前7年(1881—86)是与男子单打一起进行的,事实上美国网球锦标赛即美国网球公开赛在历史上曾九次在不同地点举办,这其中就包括美国网球协会的国家网球中心。
1887年,也就是男子锦标赛作为每年一次的赛事规范的6年后,第一届官方组织的美国女子单打锦标赛在费城的板球俱乐部举行,1889年女子双打也成为这项比赛的一个项目。在美国网球公开赛的所有五个单项中,女子单打的比赛场地是最稳定的一个——只在三个地点举办过:费城,西边网球俱乐部和美国网球中心。
全美混和双打锦标赛官方的正式开始时间为1892年,当时是与女子单打和双打一同进行的。直到1921年,混双与美国网球锦标赛的男子双打一同进行。
从1968年开始,在纽约森林山举行的集美国五项主要网球锦标赛为一体的美国网球锦标赛被列为正式公开赛。那一年的总奖金为10万美元,共有96名男选手和63名女选手参加了男子和女子项目的比赛。(混双在1968年没有列为比赛项目。)
美国公开赛的影响虽比不上温布尔登,却高于澳大利亚、甚至法国公开赛。每年一届,通常在8-9月间。开始名为“全美冠军赛” ,那只是由业余选手参赛的一项锦标赛。经过组委会的不懈努力,美网才从业余赛事发展到现在世界上奖金最丰厚的大满贯赛事。每年的夏天在美国国家网球中心进行的美国网球公开赛都能吸引超过50万的球迷到现场观看。
Das Tennisturnier US Open ist das vierte Grand-Slam-Turnier des Jahres. Es wird im August/September in New York am USTA Billie Jean King National Tennis Center in Flushing Meadows ausgespielt.
Der Namensbestandteil Open (englisch für offen) verweist darauf, dass die Veranstaltung für Teilnehmer ohne Ansehen ihres Status (Amateur, Profi), Geschlechts, Alters usw. offen ist.
1881 wurden die ersten U.S. National Championships bei den Herren ausgetragen. Der Damenwettbewerb wurde erstmals 1887 ausgespielt. Die ersten Austragungen fanden noch nicht in New York statt, sondern bei den Herren im Newport Casino in Newport, Rhode Island; auf diesem Gelände findet heute das ATP-Turnier von Newport statt. Die Damen trugen ihre Wettbewerbe im Philadelphia Cricket Club in Philadelphia aus. Im Jahr 1915 wechselte der Austragungsort in den West Side Tennis Club in Forest Hills im New Yorker Ortsteil Queens, 1978 zog man wenige Kilometer weiter nach Flushing Meadows. Im dort errichteten USTA Billie Jean King National Tennis Center diente zunächst das Louis Armstrong Stadium als Center Court, bis man dort 1997 das Arthur Ashe Stadium erbaut hat. Dieses nach dem US-amerikanischen Tennisspieler Arthur Ashe benannte Stadion ist mit 22.547 Sitzplätzen die mit Abstand größte Tennisanlage der Welt. Bis einschließlich 1974 wurden die US Open auf Rasen ausgetragen, ehe man für drei Jahre auf Sandplätze (Har-Tru) wechselte. Seit 1978 wird auf Hartplatzbelag (DecoTurf), einem Beton-Kunststoff-Gemisch gespielt.
Traditionell findet das Finale im Herreneinzel am Sonntag und das Endspiel der Damen am Samstag statt. 2008 konnte ein Damen-Halbfinale wegen Regens am Samstag nicht beendet werden; es musste auf den regulären Finaltag der Herren verschoben werden. Dadurch fand zum ersten Mal seit 1987 das Finale der Männer an einem Montag statt. Auch in den folgenden vier Jahren musste das Herrenfinale aufgrund von Regen auf den Montag verschoben werden. Wegen des Super-Saturday, an dem sowohl die Halbfinalspiele der Herren als auch das Damenfinale vorgesehen sind, sind Regenunterbrechungen am letzten Wochenende bei den US Open nur schwer ohne Verschiebung des Herrenendspiels zu kompensieren. Wegen dieser wetterbedingten Gründe, aber auch auf Wunsch vieler Spieler entschloss man sich, ab 2013 sowohl das Damen- als auch Herrenfinale um einen Tag zu verschieben; somit findet das Herrenfinale regulär am Montag statt und der Super-Saturday gehört der Geschichte an.
Seit 2016 besitzt der Arthur Ashe Court ein verschiebbares Dach, welches bei Regen geschlossen werden kann. Somit kann eine Begegnung bei einsetzendem Regen fortgesetzt werden, wobei sie für ca. fünfzehn Minuten, die man für die Schließung des Daches braucht, unterbrochen wird. Da das Turnier innerhalb der zweiten Woche im Wesentlichen auf dem Arthur Ashe Court ausgetragen wird, sind somit wetterbedingte Spielabbrüche oder gar Verschiebungen ausgeschlossen. Seitdem ist man wieder zum alten Modus der Austragung des Damenfinales am Samstag, sowie des Herrenfinales am Sonntag zurückgekehrt.
全米オープン(英語:US Open)は、アメリカ・ニューヨーク市郊外にあるフラッシング・メドウのUSTAナショナル・テニス・センターを会場として、毎年8月の最終月曜日から2週間の日程で行われる4大国際大会の一つである。観客動員数や賞金総額はテニス競技大会で最大である。主催および運営は全米テニス協会(USTA)。
The United States Open Tennis Championships is a hard court tennis tournament. The tournament is the modern version of one of the oldest tennis championships in the world, the U.S. National Championship, for which men's singles was first played in 1881.
Since 1987, the US Open has been chronologically the fourth and final Grand Slam tournament of the year. The other three, in chronological order, are the Australian Open, the French Open, and Wimbledon. The US Open starts on the last Monday of August and continues for two weeks, with the middle weekend coinciding with the U.S. Labor Day holiday.
The tournament consists of five primary championships: men's and women's singles, men's and women's doubles, and mixed doubles. The tournament also includes events for senior, junior, and wheelchair players. Since 1978, the tournament has been played on acrylic hard courts at the USTA Billie Jean King National Tennis Center in Flushing Meadows–Corona Park, Queens, New York City. The US Open is owned and organized by the United States Tennis Association (USTA), a non-profit organization, and the chairperson of the US Open is Katrina Adams.[citation needed] Revenue from ticket sales, sponsorships, and television contracts are used to develop tennis in the United States.
The US Open is the only Grand Slam tournament that employs tiebreakers in every set of a singles match. For the other three Grand Slam events, a match that reaches 6–6 in the last possible set (the third for women and the fifth for men) continues until a player takes a two-game lead. As with the US Open, those events use tiebreakers to decide the other sets.
The US Open also is the only Grand Slam tournament with 16 qualifiers (instead of 12) in the women's singles draw.
L'US Open de tennis est un tournoi de tennis se déroulant annuellement dans le parc municipal de Flushing Meadows-Corona Park à New York, au sein de l'USTA National Tennis Center. Appelé « US National Championships » jusqu'en 1967, il se joue depuis 1881 et a connu plusieurs implantations. D'abord joué à Newport, il déménage ensuite au sein du West Side Tennis Club avant de s'implanter à Flushing Meadows en 1978. D'abord uniquement ouvert aux hommes, les femmes font leur entrée dans le tournoi en 1887. À partir de 1968 et comme tous les autres tournois, il s'ouvre aux professionnels. Aux côtés du simple messieurs et simple dames se déroulent aussi des compétitions de double messieurs, double dames et double mixte. Le tournoi fait partie de la catégorie des Grands Chelems au nombre de quatre : l'Open d'Australie, les Internationaux de France de tennis (Roland-Garros), Wimbledon et l'US Open, le dernier de l'année, joué de la fin août au début du mois de septembre.
Se jouant sur deux semaines, il est le point culminant de la saison estivale américaine sur dur qualifiée d'« US Open Series ». Après s'être joué de 1881 à 1975 sur gazon, l'US Open s'est brièvement tenu sur terre battue américaine de 1975 à 1977 avant d'adopter une surface dure de type Decoturf en 1978. Cette surface plus neutre que le gazon ou la terre battue est particulièrement rapide et avantage plutôt les joueurs de type offensif comme les serveurs-volleyeurs (John McEnroe ou encore Pete Sampras). Après le changement de composition du gazon de Wimbledon en 2000, l'US Open est devenu le Grand Chelem le plus rapide mais du fait d'une disparition du service-volée et d'un léger ralentissement de la surface, le jeu pratiqué à l'US Open privilégie principalement les échanges de fond du court.
Il torneo di tennis degli US Open è il quarto e ultimo dei tornei del Grande Slam. Si tiene tra agosto e settembre; il torneo principale è composto da cinque categorie: singolare maschile e femminile, doppio maschile, femminile e misto. In aggiunta a questi si hanno tornei per juniores e seniores. Dal 1978 il torneo si tiene sui campi in cemento di Flushing Meadows a New York.
Lo US Open è cresciuto da evento esclusivo di intrattenimento per l'alta società fino a diventare un campionato che mette in palio 16 milioni di dollari in premi per oltre 600 tennisti professionisti (maschi e femmine).
El Abierto de los Estados Unidos (en inglés, US Open) antiguamente conocido como Campeonato nacional de Estados Unidos es el cuarto y último torneo Grand Slam de tenis de la temporada. Se disputa anualmente entre agosto y septiembre, en cinco modalidades: individuales de hombres y mujeres, dobles de hombres y mujeres y dobles mixtos, aunque existen también torneos adicionales para jugadores juniors y seniors. Desde 1978, el torneo se disputa en el USTA Billie Jean King National Tennis Center (renombrado así en 2006), en Flushing Meadows, Nueva York.
El Abierto de los Estados Unidos pasó de ser un evento puramente recreativo de la alta sociedad, a un torneo que reparte 16 millones de dólares entre más de 600 participantes, incluyendo cerca de un millón para los ganadores de los torneos individuales. En 2017 el ganador de la rama masculina fue el español Rafael Nadal mientras que el femenino fue ganado por la estadounidense Sloane Stephens.
Открытый чемпионат США по теннису (англ. The United States Open Tennis Championships; US Open) — один из четырёх турниров Большого шлема, ныне проводящийся в американском городе Нью-Йорк на кортах местного Национального теннисного центра. Основные сетки соревнования традиционно проводятся в двухнедельный отрезок на рубеже лета и осени, выявляя победителей в девяти разрядах: в пяти — у взрослых и четырёх — у старших юниоров.
Организатор турнира — Ассоциация тенниса США. C 1978 года игровым покрытием является одна из модификаций хардового корта.
 Transport und Verkehr
 Connecticut-CT
 Florida-FL
 Geographie
 Georgia-GA
 Maine-ME
 Maryland-MD
 Massachusetts-MA
 New hampshire-NH
 New jersey-NJ
 New York-NY
 North Carolina-NC
 Pennsylvania-PA
 Rhode Island-RI
 South Carolina-SC
Vereinigte Staaten
South Carolina-SC
Vereinigte Staaten
 Virginia-VA
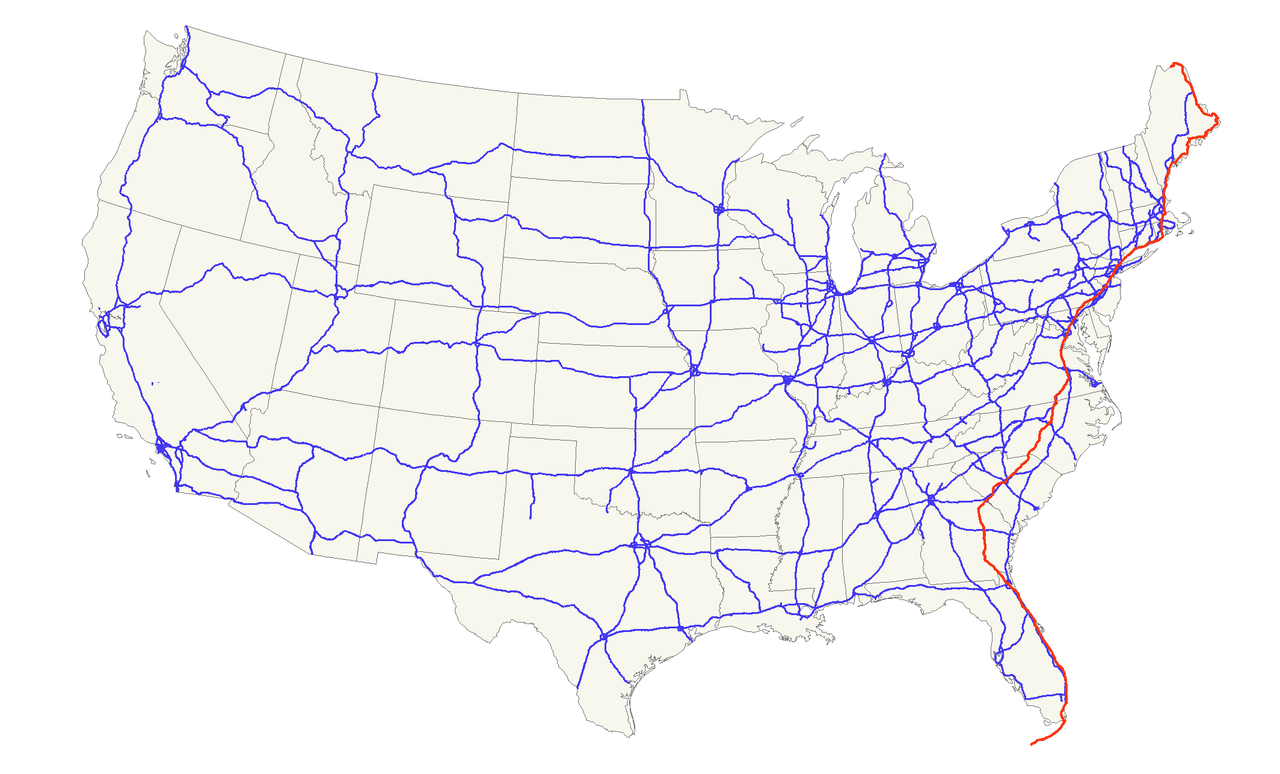
Der U.S. Highway 1 (auch U.S. Route 1 oder US 1) ist ein Highway, der parallel zur US-amerikanischen Ostküste verläuft. Die Gesamtlänge beträgt 3846 Kilometer. Im Norden endet der Highway in Fort Kent in Maine an der kanadischen Grenze. Im Süden ist es Key West an Floridas Küste zum Golf von Mexiko. Die US Route 1 verläuft an vielen Orten parallel zur Interstate 95. Festgelegt wurde sie 1926 zunächst nur zwischen der kanadischen Grenze und dem U.S. Highway 94 in Miami.
Die wichtigsten Städte, die der Highway passiert, sind Miami, Columbia, Richmond, Washington, D.C., Baltimore, Philadelphia, New York City, Boston und Portland.
Der Highway trägt die Nummer eins, weil er der am östlichsten gelegene ist und Nord-Süd-Highways von Ost nach West nummeriert werden.
 California-CA
 Colorado-CO
Geographie
Colorado-CO
Geographie
 Illinois-IL
 Indiana-IN
 Kansas-KS
Maryland-MD
Kansas-KS
Maryland-MD
 Missouri-MO
 Nevada-NV
 Ohio-OH
 Utah-UT
Vereinigte Staaten
Virginia-VA
Utah-UT
Vereinigte Staaten
Virginia-VA
 Washington, D.C.
 West Virginia-WV

 Arizona-AZ
California-CA
Geographie
Illinois-IL
Kansas-KS
Missouri-MO
Arizona-AZ
California-CA
Geographie
Illinois-IL
Kansas-KS
Missouri-MO
 New mexico-NM
 Oklahoma-OK
 Texas-TX
Vereinigte Staaten
Texas-TX
Vereinigte Staaten
 FIFA Fussball-Weltmeisterschaft 2014
FIFA Fussball-Weltmeisterschaft 2022
FIFA Fussball-Weltmeisterschaft 2022
FIFA Fussball-Weltmeisterschaft 2014
FIFA Fussball-Weltmeisterschaft 2022
FIFA Fussball-Weltmeisterschaft 2022
 Gruppe B
 FIFA Fussball-Weltmeisterschaft 2026
 Sport
(F)CONCACAF Gold Cup
Vereinigte Staaten
Sport
(F)CONCACAF Gold Cup
Vereinigte Staaten


*Politisches System der Vereinigten Staaten
 Hand in Hand
Institut für Kultur und Sprache
Washington, D.C.
Hand in Hand
Hand in Hand
Institut für Kultur und Sprache
Washington, D.C.

 Alabama-AL
Arizona-AZ
Alabama-AL
Arizona-AZ
 Arkansas-AR
California-CA
Colorado-CO
Connecticut-CT
Arkansas-AR
California-CA
Colorado-CO
Connecticut-CT
 Energieressource
*Elektrische Energie
Florida-FL
Georgia-GA
Energieressource
Energieressource
*Elektrische Energie
Florida-FL
Georgia-GA
 Hawaii-HI
 Idaho-ID
Indiana-IN
Idaho-ID
Indiana-IN
 Iowa-IA
 Kentucky-KY
 Louisiana-LA
Maine-ME
Maryland-MD
Massachusetts-MA
Louisiana-LA
Maine-ME
Maryland-MD
Massachusetts-MA
 Michigan-MI
 Minnesota-MN
 Montana-MT
New hampshire-NH
New jersey-NJ
New York-NY
North Carolina-NC
Oklahoma-OK
Montana-MT
New hampshire-NH
New jersey-NJ
New York-NY
North Carolina-NC
Oklahoma-OK
 Oregon-OR
Pennsylvania-PA
South Carolina-SC
Texas-TX
Vereinigte Staaten
Oregon-OR
Pennsylvania-PA
South Carolina-SC
Texas-TX
Vereinigte Staaten
 Vermont-VT
Virginia-VA
Vermont-VT
Virginia-VA
 Washington-WA
 Wisconsin-WI

| Last Modified on November 21, 2022 *Capacity noted in (MW) |
| Plant | Location | Feedstock | Capacity |
|---|---|---|---|
| Agrilectric Power Partners Ltd. | LA | Rice hulls | 12.00 |
| Albany Green Energy | GA | Forest residue, urban wood waste, pecan shells, peanut hulls | 50.00 |
| Allendale Biomass | SC | Mill/forestry residue | 20.00 |
| Altavista Power Station | VA | Woody biomass | 51.00 |
| Arnold O. Chantland Incineration Plant | IA | MSW/Refused-derived fuel (RDF) | 4.00 |
| Barron County Waste-to-Energy & Recycling Facility | WI | MSW | 2.00 |
| Bay Front Power Plant | WI | Wood waste | 56.00 |
| Biomass One | OR | Logging/wood debris | 30.00 |
| Bridgewater Power LP | NH | Woody biomass | 20.00 |
| Buckeye Florida Biomass | FL | Wood waste, black liquor | 69.40 |
| Burgess BioPower | NH | Wood waste | 75.00 |
| Burney Forest Power | CA | Wood waste | 31.00 |
| Cadillac Renewable Energy | MI | Forest residue | 40.00 |
| City of Spokane Waste to Energy Facility | WA | MSW | 22.00 |
| Collins Pine Co. Power Plant | CA | Forest thinnings/residue | 12.00 |
| Covanta Alexandria | VA | MSW | 22.00 |
| Covanta Babylon | NY | MSW | 17.00 |
| Covanta Bristol | CT | MSW | 16.00 |
| Covanta Camden | NJ | MSW | 21.00 |
| Covanta Dade | FL | MSW, wood waste | 77.00 |
| Covanta Delaware Valley | PA | MSW | 87.00 |
| Covanta Essex | NJ | MSW | 66.00 |
| Covanta Fairfax | VA | MSW | 93.00 |
| Covanta Harrisburg | PA | MSW | 21.00 |
| Covanta Haverhill | MA | MSW | 45.00 |
| Covanta Hempstead | NY | MSW | 72.00 |
| Covanta Hillsborough | FL | MSW | 47.00 |
| Covanta Honolulu | HI | MSW | 90.00 |
| Covanta Huntington | NY | MSW | 24.00 |
| Covanta Indianapolis | IN | MSW | 6.50 |
| Covanta Kent | MI | MSW | 17.00 |
| Covanta Lake | FL | MSW | 15.00 |
| Covanta Lancaster | PA | MSW | 33.00 |
| Covanta Lee | FL | MSW | 57.00 |
| Covanta Long Beach | CA | MSW | 36.00 |
| Covanta MacArthur | NY | MSW | 12.00 |
| Covanta Marion | OR | MSW | 13.00 |
| Covanta Montgomery | MD | MSW | 63.00 |
| Covanta Niagara | NY | MSW | 50.00 |
| Covanta Onondaga | NY | MSW | 39.00 |
| Covanta Palm Beach Renewable Energy #1 | FL | MSW | 62.00 |
| Covanta Palm Beach Renewable Energy #2 | FL | MSW | 95.00 |
| Covanta Pasco | FL | MSW | 30.00 |
| Covanta Pinellas | FL | MSW | 75.00 |
| Covanta Plymouth | PA | MSW | 32.00 |
| Covanta SECONN | CT | MSW | 17.00 |
| Covanta SEMASS | MA | MSW | 78.00 |
| Covanta Stanislaus | CA | MSW | 22.00 |
| Covanta Tulsa | OK | MSW | 17.00 |
| Covanta Union | NJ | MSW | 42.00 |
| Covanta York | PA | MSW | 42.00 |
| Cox Waste-to-Energy | KY | Wood waste | 5.00 |
| Craven County Wood Energy | NC | Wood chips, forestry residue, mill waste, bark, sawdust, poultry litter | 50.00 |
| Deerhaven Renewable Generating Station | FL | Wood waste | 102.50 |
| Desert View Power | CA | Woody biomass | 45.00 |
| DG Fairhaven Power | CA | Wood waste | 18.00 |
| Dillard Complex Cogeneration Plant | OR | Mill residue | 51.50 |
| Dorchester Biomass | SC | Mill/forestry residue | 20.00 |
| Douglas County Forest Products | OR | Wood residue | 6.00 |
| DTE Stockton Biomass Power | CA | Woody biomass, ag residue | 45.00 |
| Eagle Valley Clean Energy | CO | Forest restoration thinnings/residue | 12.00 |
| Ecomaine Waste-to-Energy Plant | ME | MSW | 14.00 |
| Evergreen Biopower LLC | OR | Mill residue | 10.00 |
| Fernandina Biomass Plant | FL | Mill residuals | 22.50 |
| French Island Generating Station | WI | MSW/RDF, wood waste, railroad ties | 28.00 |
| Genesee Power Station | MI | Landscaping/storm debris, waste wood | 40.00 |
| Grayling Generating Station | MI | Forestry residue, mill waste, bark | 38.00 |
| Green Energy Team LLC | HI | Eucalyptus, albizia | 7.50 |
| GRP-Franklin LLC | GA | C&D waste | 65.00 |
| GRP-Madison LLC | GA | C&D waste | 65.00 |
| Halifax County Biomass Plant | VA | Logging waste, forest slash | 49.90 |
| Hennepin Energy Recovery Center | MN | MSW | 40.00 |
| Hillman Power LLC | MI | Wood waste | 20.00 |
| Honey Lake Power | CA | High-hazard forest material/thinnings | 30.00 |
| Hopewell Power Station | VA | Woody biomass | 51.00 |
| Joseph C McNeil Generating Station | VT | Logging residue, bark, shavings, clean urban wood waste | 50.00 |
| Kapstone Kraft Paper Corp.-Longview | WA | Mill residue, wood waste | 25.00 |
| Kettle Falls Generating Station | WA | Logging/mill residue | 53.00 |
| Koda Energy LLC | MN | Oat/rice hulls, corn, barley and malt screening, urban tree waste | 23.40 |
| L'Anse Warden Electric Company | MI | Wood waste, railroad ties | 20.00 |
| M.L. Hibbard Energy Center | MN | Wood waste | 72.80 |
| Macon Mill | GA | Logging waste | 38.00 |
| McKay Bay Refuse-to-Energy Plant | FL | MSW | 22.00 |
| McKinley Paper Cogeneration Facility | WA | Logging/mill residue | 9.50 |
| Merced Power | CA | Ag waste | 12.50 |
| MMWAC Resource Recovery Facility | ME | MSW | 5.00 |
| Mt. Poso Cogeneration Co. LLC | CA | Wood waste | 44.00 |
| Multitrade Rabun Gap | GA | Woody biomass | 18.00 |
| National Energy-Lincoln | MI | Wood waste | 18.00 |
| National Energy-McBain | MI | Wood waste | 18.00 |
| North Carolina Renewable Power | NC | C&D waste, wood waste, poultry litter | 22.00 |
| North Fork Community Power | CA | High-hazard forest material | 2.00 |
| Novo BioPower LLC | AZ | Wood waste | 27.00 |
| Okeelanta Biomass Cogeneration | FL | Baggasse, natural gas | 74.90 |
| Olmsted Waste-To-Energy Facility | MN | MSW | 9.60 |
| Oswego Energy Recovery Facility | NY | MSW | 4.00 |
| Pacific Ultrapower Chinese Station | CA | Woody biomass | 25.00 |
| Penobscot Energy Recovery | ME | MSW | 25.00 |
| Piedmont Green Power | GA | Urban wood waste, mill and logging residue | 55.00 |
| Plainfield Renewable Energy | CT | C&D/forestry waste | 37.50 |
| Plummer Cogen | ID | Wood waste | 6.20 |
| Potlatch Land & Lumber Power Plant | AR | Bark, sawdust, shavings | 10.00 |
| Rapids Energy Center | MN | Logging/mill residue | 28.60 |
| Red Wing Generating Station | MN | MSW/RDF | 22.00 |
| ReEnergy Black River | NY | Woody biomass | 60.00 |
| ReEnergy Livermore Falls | ME | Forest residue, C&D waste | 39.00 |
| ReEnergy Stratton | ME | Forest/mill residue | 48.00 |
| Resolute Forest Products Coosa Pines | AL | Wood-processing waste | 30.00 |
| Rio Bravo Fresno | CA | Ag/urban wood waste | 24.30 |
| Rio Bravo Rocklin | CA | High-hazard forest material, ag/urban waste | 24.40 |
| RockTenn-Tacoma Mill | WA | Mill residue | 55.00 |
| Roseburg Forest Products Biomass | CA | Wood waste | 13.00 |
| Rothschild Biomass Cogeneration Plant | WI | Urban wood waste, mill residue | 50.00 |
| Savannah River Site Biomass Cogeneration Facility | SC | Forest residue | 20.00 |
| Scotia Cogen | CA | Wood waste | 28.00 |
| SDS Lumber Gorge Energy Division | WA | Logging/mill residue | 10.00 |
| Shasta-Sustainable Resource Management | CA | Wood waste, forest residue | 56.00 |
| Southampton Power Station | VA | Woody biomass | 51.00 |
| Southern Co. Nacogdoches Generating Facility | TX | Forest/wood processing residue | 115.00 |
| SPI-Aberdeen Biomass Power | WA | Logging/mill residue | 18.00 |
| SPI-Anderson Biomass Power | CA | Logging/mill residue | 30.00 |
| SPI-Burlington Biomass Power | WA | Logging/mill residue | 28.00 |
| SPI-Burney | CA | Logging/mill residue | 20.00 |
| SPI-Eugene | OR | Mill, forest residue | 19.80 |
| SPI-Lincoln Biomass Power | CA | Logging/mill residue | 18.00 |
| SPI-Quincy Biomass Power | CA | Mill residue | 35.20 |
| SPI-Sonora Biomass Power | CA | Logging/mill residue | 10.90 |
| St. Paul Cogeneration LLC | MN | Urban wood residue | 33.00 |
| Stoltze Cogeneration Power Plant | MT | Mill residue | 3.00 |
| Stored Solar Bethlehem | NH | Logging residue, forest thinnings | 20.00 |
| Stored Solar Fitchburg | MA | Woody biomass | 17.00 |
| Stored Solar Jonesboro | ME | Woody biomass | 25.00 |
| Stored Solar Ryegate | VT | Woody biomass | 20.00 |
| Stored Solar Springfield | NH | Woody biomass | 19.00 |
| Stored Solar Tamworth | NH | Woody biomass | 20.00 |
| Stored Solar West Enfield | ME | Woody biomass | 25.00 |
| Stored Solar Whitefield | NH | Woody biomass | 15.00 |
| Telogia Power | FL | Logging/mill residue, hog fuel, peanut hulls | 14.00 |
| U.S. Sugar Corp. Cogeneration Plant | FL | Bagasse | 50.00 |
| Virginia City Hybrid Energy Center | VA | *Woody biomass | 120.00 |
| Wadham Energy LP | CA | Rice hulls | 30.00 |
| Westervelt Renewable Energy Moundville | AL | Wood waste | 13.00 |
| WestRock Covington | VA | Logging, papermaking residue | 75.00 |
| Wheelabrator Baltimore | MD | MSW | 64.50 |
| Wheelabrator Bridgeport | CT | MSW | 67.00 |
| Wheelabrator Concord | NH | MSW | 14.00 |
| Wheelabrator Dutchess County | NY | MSW | 9.00 |
| Wheelabrator Falls | PA | MSW | 53.00 |
| Wheelabrator Gloucester | NJ | MSW | 14.00 |
| Wheelabrator Hudson Falls | NY | MSW | 14.00 |
| Wheelabrator Lisbon | CT | MSW | 15.00 |
| Wheelabrator Millbury | MA | MSW | 48.00 |
| Wheelabrator North Andover | MA | MSW | 40.00 |
| Wheelabrator Portsmouth | VA | MSW | 60.00 |
| Wheelabrator Saugus | MA | MSW | 54.00 |
| Wheelabrator South Broward | FL | MSW | 66.00 |
| Wheelabrator Westchester LP | NY | MSW | 60.00 |
| Wilmarth Generating Station | MN | MSW/RDF, woody biomass | 18.00 |
| Woodland Biomass Power | CA | Wood chips, urban wood waste, ag waste | 25.00 |
| Total Plants: 159 | Total capacity(MW): | 5,583.90 |
*Politisches System der Vereinigten Staaten
 Finanz
*Vereinigte Staaten-Konjunkturdaten
United States Department of Energy
Advanced Research Projects Agency-Energy
United States Department of Energy
Bonneville Power Administration
United States Department of Energy
Credit Review Board
United States Department of Energy
Energy Council
United States Department of Energy
Energy Systems Acquisition Advisory Board,ESAAB
United States Department of Energy
Federal Energy Regulatory Commission
United States Department of Energy
National Laboratory Policy Council
United States Department of Energy
National Nuclear Security Administration,NNSA
United States Department of Energy
Nuclear Security Council
United States Department of Energy
Office of Inspector General
United States Department of Energy
Office of Under Secretary for Management and Performance
United States Department of Energy
Office of Under Secretary for Science and Energy
United States Department of Energy
Secretary
United States Department of Energy
Secretary of Energy Advisory Board
United States Department of Energy
Southeastern Power Administration
United States Department of Energy
Southwestern Power Administration
United States Department of Energy
U.S. Energy Information Administration
United States Department of Energy
United States Department of Energy national laboratories
United States Department of Energy
Western Area Power Administration
Washington, D.C.
Finanz
*Vereinigte Staaten-Konjunkturdaten
United States Department of Energy
Advanced Research Projects Agency-Energy
United States Department of Energy
Bonneville Power Administration
United States Department of Energy
Credit Review Board
United States Department of Energy
Energy Council
United States Department of Energy
Energy Systems Acquisition Advisory Board,ESAAB
United States Department of Energy
Federal Energy Regulatory Commission
United States Department of Energy
National Laboratory Policy Council
United States Department of Energy
National Nuclear Security Administration,NNSA
United States Department of Energy
Nuclear Security Council
United States Department of Energy
Office of Inspector General
United States Department of Energy
Office of Under Secretary for Management and Performance
United States Department of Energy
Office of Under Secretary for Science and Energy
United States Department of Energy
Secretary
United States Department of Energy
Secretary of Energy Advisory Board
United States Department of Energy
Southeastern Power Administration
United States Department of Energy
Southwestern Power Administration
United States Department of Energy
U.S. Energy Information Administration
United States Department of Energy
United States Department of Energy national laboratories
United States Department of Energy
Western Area Power Administration
Washington, D.C.

 Universitäten in den USA

A college endowment refers to all the money that an institution receives in donations. However, endowment funds are not ‘no-questions-asked’ cash boosts for the college. Instead, endowments are tightly controlled investments that are supposed to be grown so that the interest can be used to upgrade facilities, hire new staff, provide scholarships or aid the college or its students in some way.
Over the past three decades, the total market value of the 20 largest college endowments has grown nearly tenfold — from $30.6 billion to $302.1 billion. As the size of college endowments has increased, so too has the debate over their purpose, management and ethical obligations.
To get a better idea of how college endowments have changed over the last 30 years, DegreeQuery looked at the market value of the 20 largest U.S. college endowments from 1990 to 2020.
30 Years of U.S. college endowments
Based on the most recent NACUBO survey of 810 universities, the total market value of endowments in 2018 was $624.3 billion. 48.3% of that is held by just 20 colleges. But why the huge growth in market value over the past 30 years? It might be something to do with how much of the endowment the university chooses to spend on operations or the return rates of the endowment’s investment portfolio. Due to their often wealthy donor base and long-term investment horizons, the largest university endowments can invest in a diverse array of asset classes, and often grow faster than the economy as a whole.
From 1990 to 2020, the market value of the 20 largest college endowments grew at an average annual rate of 8.5% — faster than the 6.6% average annual growth rate for the Fortune 500 over the same period. The universities with the fastest growth over the past 30 years include the University of Michigan, Duke University and the University of Notre Dame. Meanwhile, the endowments with the slowest growth include Emory University, Rice University and Washington University in St. Louis.
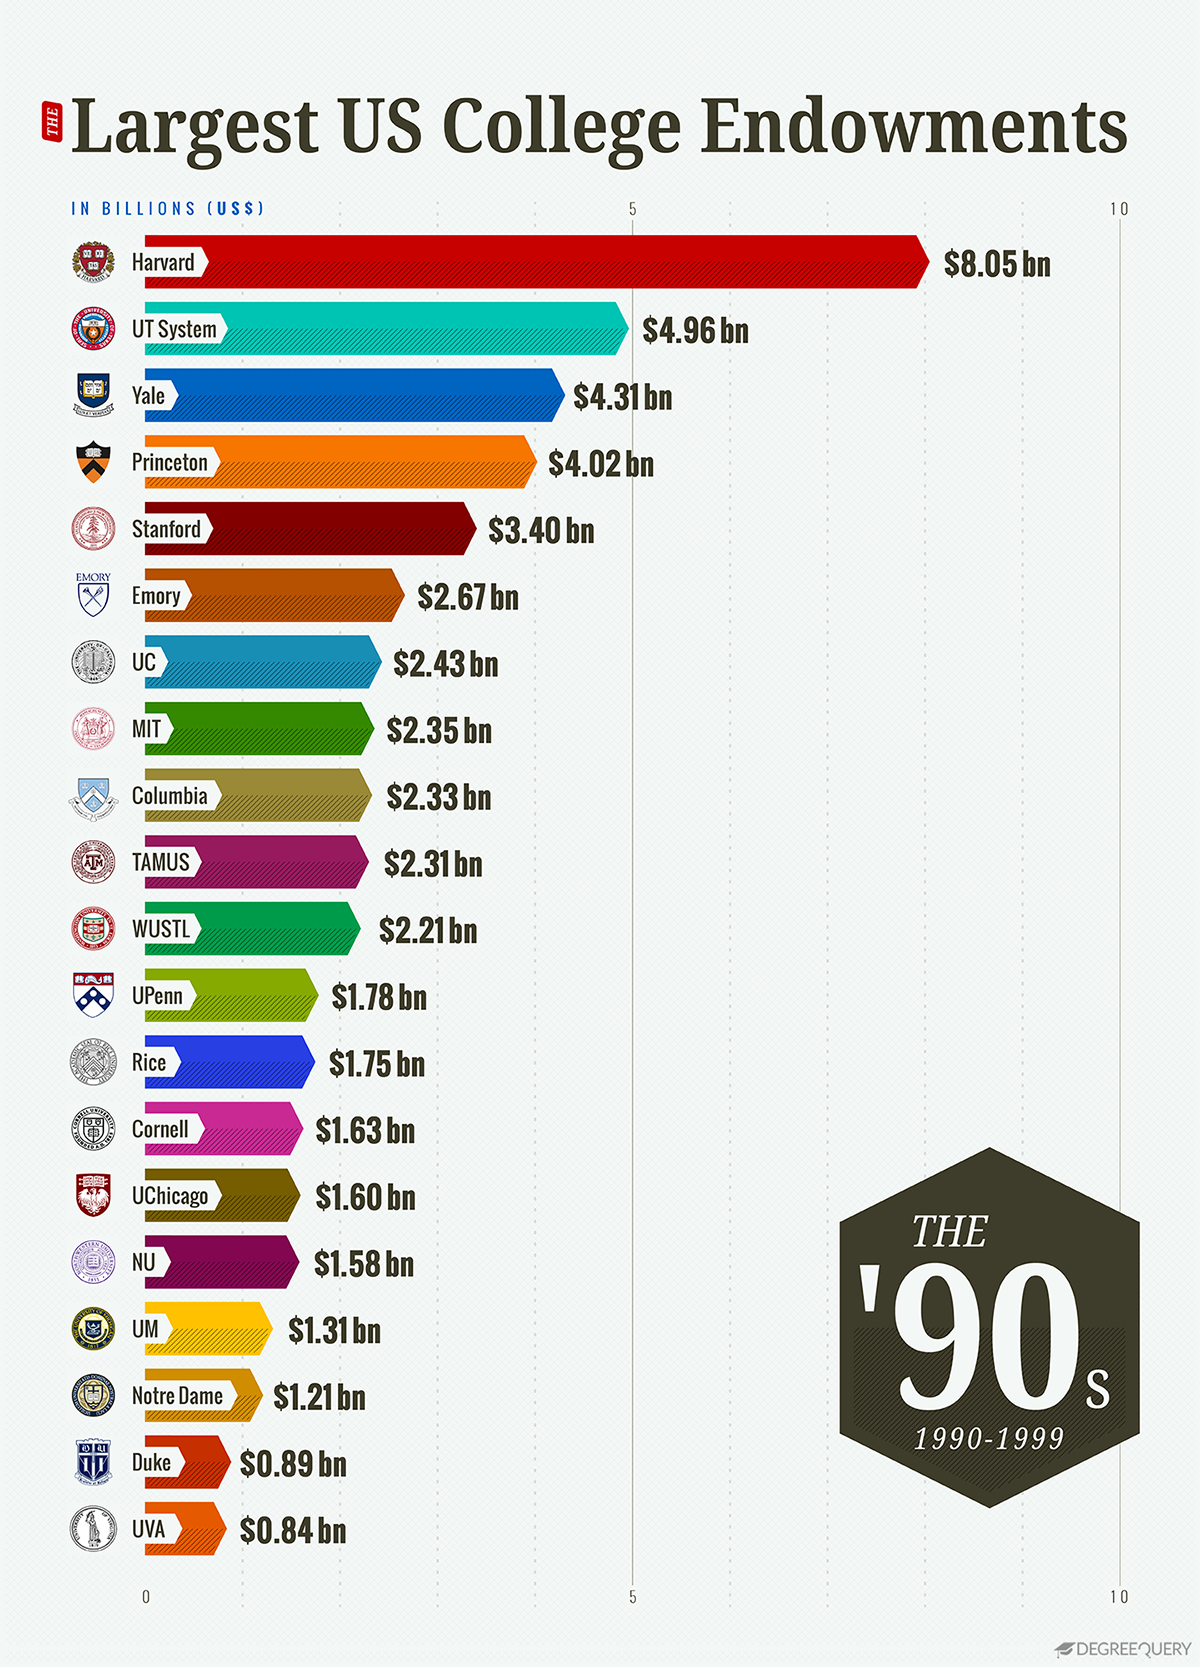
1. U.S. college endowments in the 1990s
From 1990 to 1999, the market value of the 20 largest U.S. college endowments grew at an average annual rate of 12.5% — the fastest of the last three decades. As you can see from our graph, over this period, the University of Michigan endowment rose from the 20th largest to the 17th largest, and the University of Pennsylvania rose from the 16th largest to the 12th largest. Meanwhile, the Columbia University endowment fell from the sixth-largest to the 11th largest. Although the University of Texas System endowment had the slowest growth of the 20 largest endowments over this period, it remained the second-largest endowment overall.
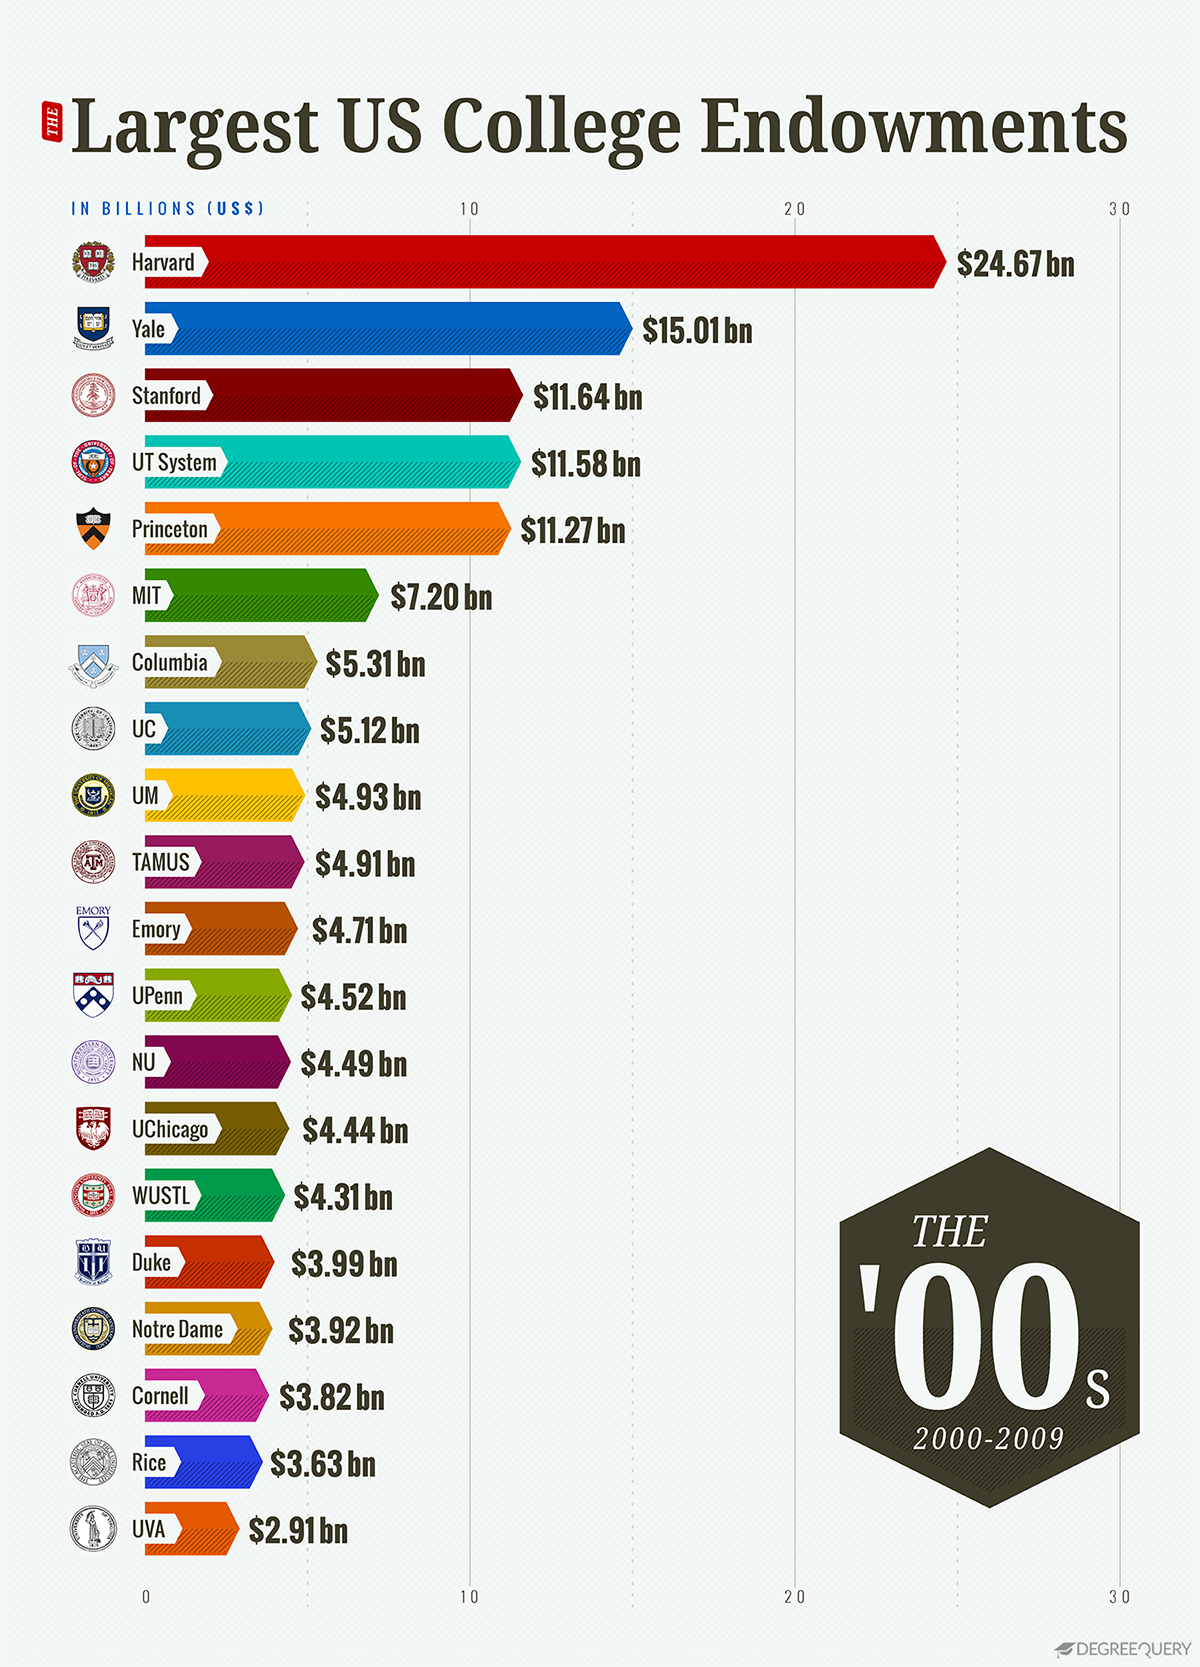
2. U.S. college endowments in the 2000s
Endowment growth is closely connected with the overall health of the economy. As of 2018, just 4% of endowment assets were held as cash, the rest invested in equities, fixed income instruments and alternative investment vehicles. In the lead up to the 2008 financial crisis — university endowments had increasingly invested in high-risk, illiquid investments like private equity, real estate and hedge funds. As a result, endowments lost tens of billions of dollars in value, with some schools losing more than 25% of their total endowment value. From 2008 to 2009, the total value of the 20 largest endowments fell 3.4%. Yale posted the largest percentage decline, losing 28.6% of its market value. Other university endowments that posted big losses from the recession include Harvard, Duke and Stanford.
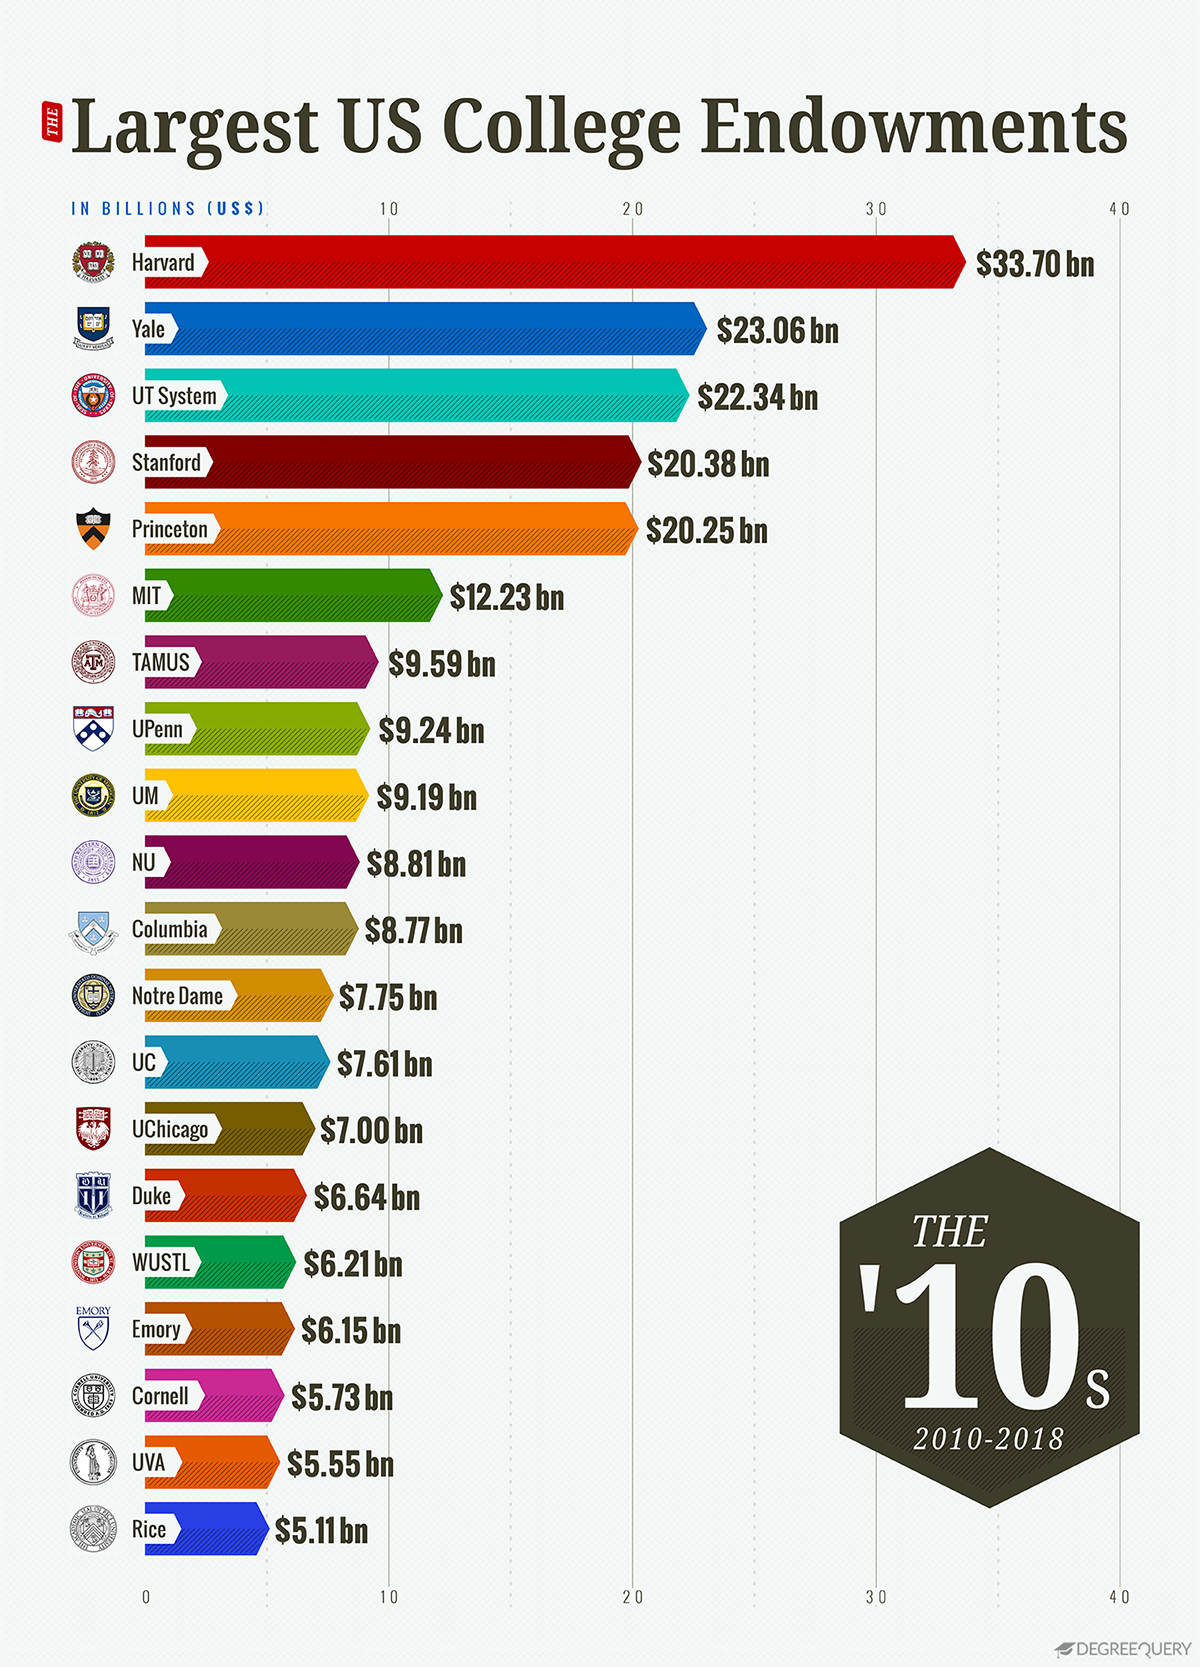
3. U.S. college endowments in the 2010s
Endowment growth rates rebounded in the wake of the Great Recession, although growth was still slow compared to the 1990s. From 2010 to 2018, the market value of the 20 largest endowments grew at an average annual rate of 7.6%. This is more than the 3.5% average annual growth rate for 2000 to 2009, yet less than the 12.5% rate for 1990 to 1999. During this period, the biggest winners were the University of Pennsylvania, rising from 11th to 7th largest, and the Texas A&M University System, which rose from 10th to 8th largest. Lackluster performance at some of the wealthiest schools has prompted some universities to make major changes to their endowment management. In 2017, for example, Harvard announced it would lay off roughly half of its 230-person staff in the wake of poor investment performance.
As you can see, university endowments were big business over the past 30 years. Nowadays, students, policymakers and the general public are increasingly involved in the conversation surrounding their management, mission and societal impact. For example, the 2017 Tax Cuts and Jobs Act, which imposed a 1.4% tax on the net investment income of the wealthiest endowments, recently sparked a wave of criticism from university administrators. Elsewhere on campus, protesting students demanded their universities divest from fossil fuel companies.
As the debate rages on and endowments continue to grow, these visualizations help us see how we got to this point.
Methodology
To get a better idea of how college endowments have changed over the last 30 years, DegreeQuery looked at the market value of the 20 largest U.S. college endowments from 1990 to 2018. Data on endowment asset value by university came from the National Association of College and University Business Officers (NACUBO) and is unadjusted for inflation. In years when certain universities did not participate in the NACUBO survey, we estimated the endowment value based on the compound annual growth rate for all available years. Estimated figures include the market value of the endowment assets for the Texas A&M University System for 1990, as well as the market value of the endowment assets for the University of California system for the years 1990 through 1992.
SOURCES
Fortune 500. (n.d.) Fortune 500 2018. fortune.com
NACUBO. (2019). Detailed Asset Allocations for U.S. College and University Endowments and Affiliated Foundations, FY18. nacubo.org
Miller, C. & Fabrikant, G. (2008). Universities retrench as endowments suffer from financial crisis. nytimes.com
Humphreys, J. et al. (2010). Educational Endowments and the Financial Crisis: Social Costs and Systemic Risks in the Shadow Banking System. tellus.org
Plender, J. (2014). There is a history lesson to be learnt from Yale endowment. ft.com
Fabrikant, G. (2017). Harvard Makes Changes in Managing a Lagging Endowment. nytimes.com
Tax Policy Center. (n.d.). What is the tax treatment of college and university endowments? taxpolicycenter.org
 Gesetz


 Wirtschaft und Handel


联邦储备系统(英语:Federal Reserve System, Fed),全称美国联邦储备系统(美联储),也称美国联邦储备理事会(联储会),是美国的中央银行体系。由美国国会通过1913年的《联邦储备法案》而创设,以避免再度发生类似1907年的银行危机。
联邦储备系统包括:“联邦储备系统理事会”(Board of Governors of the Federal Reserve System)、“联邦公开市场委员会”(Federal Open Market Committee)、“联邦储备银行” (Federal Reserve Banks)、约三千家会员银行、及三个咨询委员会(Advisory Councils)。美国联邦储备系统是以私有形式组织的行使公共目的的私营银行系统。美国政府虽不拥有美联储的股份,但美联储的94%利润(2009年 总利润为450亿美元)转交给美国财政部,剩余6%用于给会员银行发放股息;同时,美国政府任命美联储的所有高级雇员。本·伯南克(Ben Shalom Bernanke)为现任美联储理事会主席。