
Deutsch-Chinesische Enzyklopädie, 德汉百科
 United States
 *United States Political System

 Hand in Hand

 Hand in Hand
 Institute of Culture and Language

 Washington, D.C.


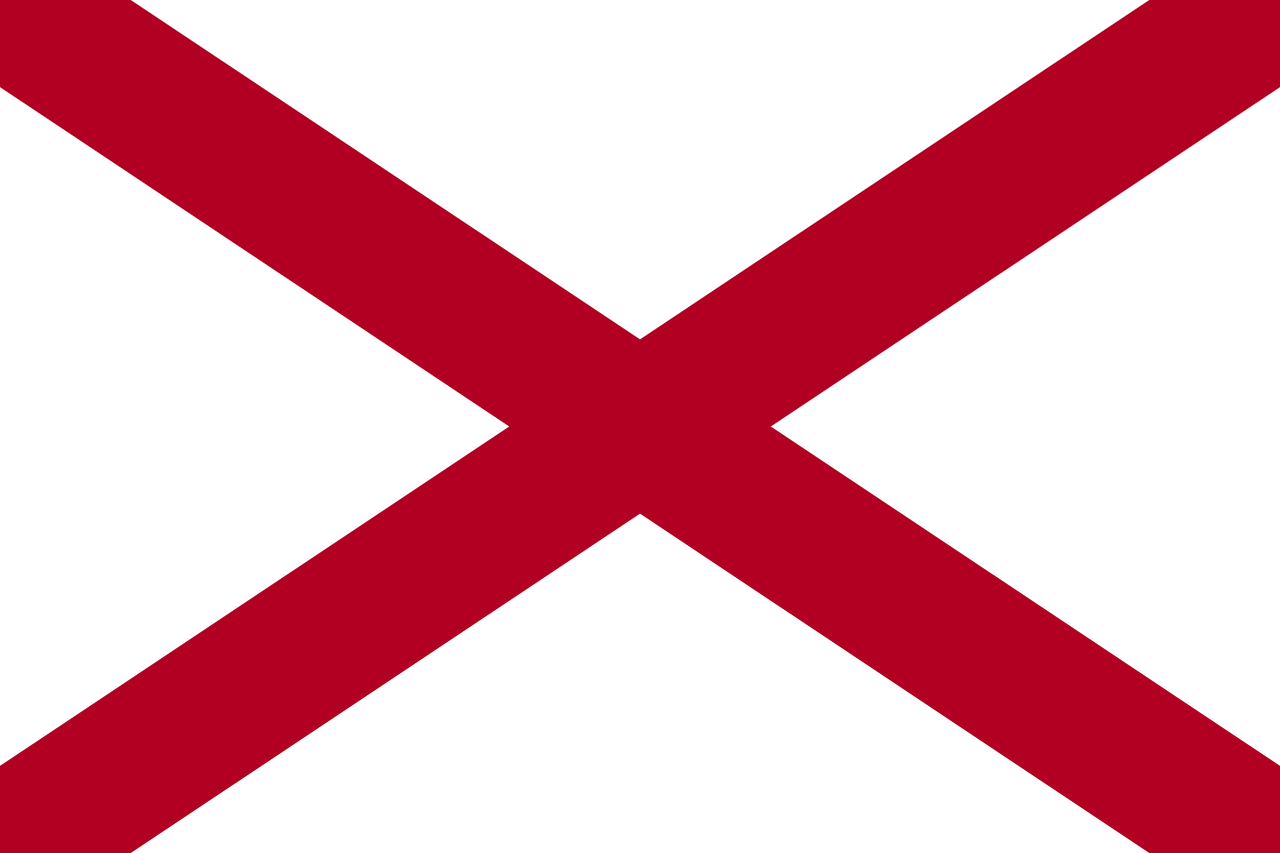 Alabama-AL

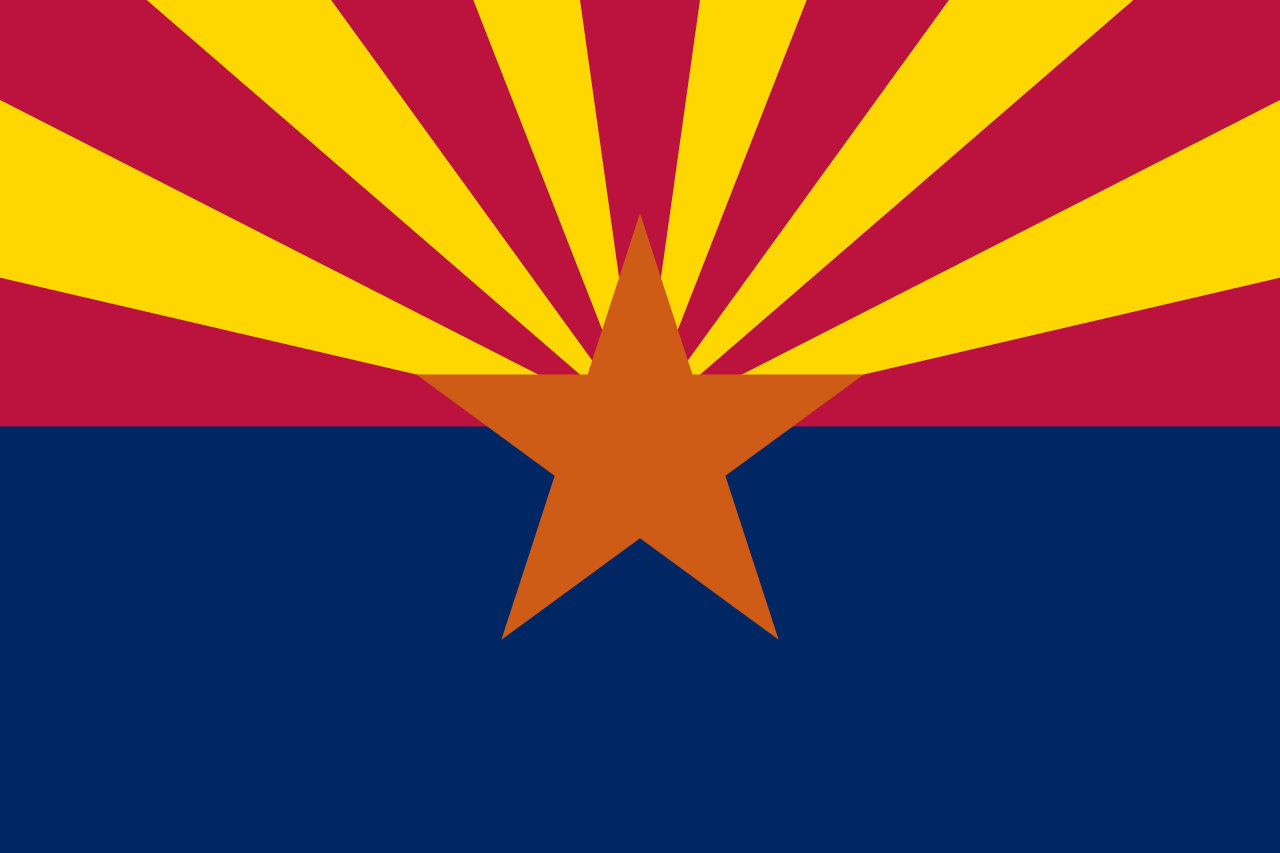 Arizona-AZ

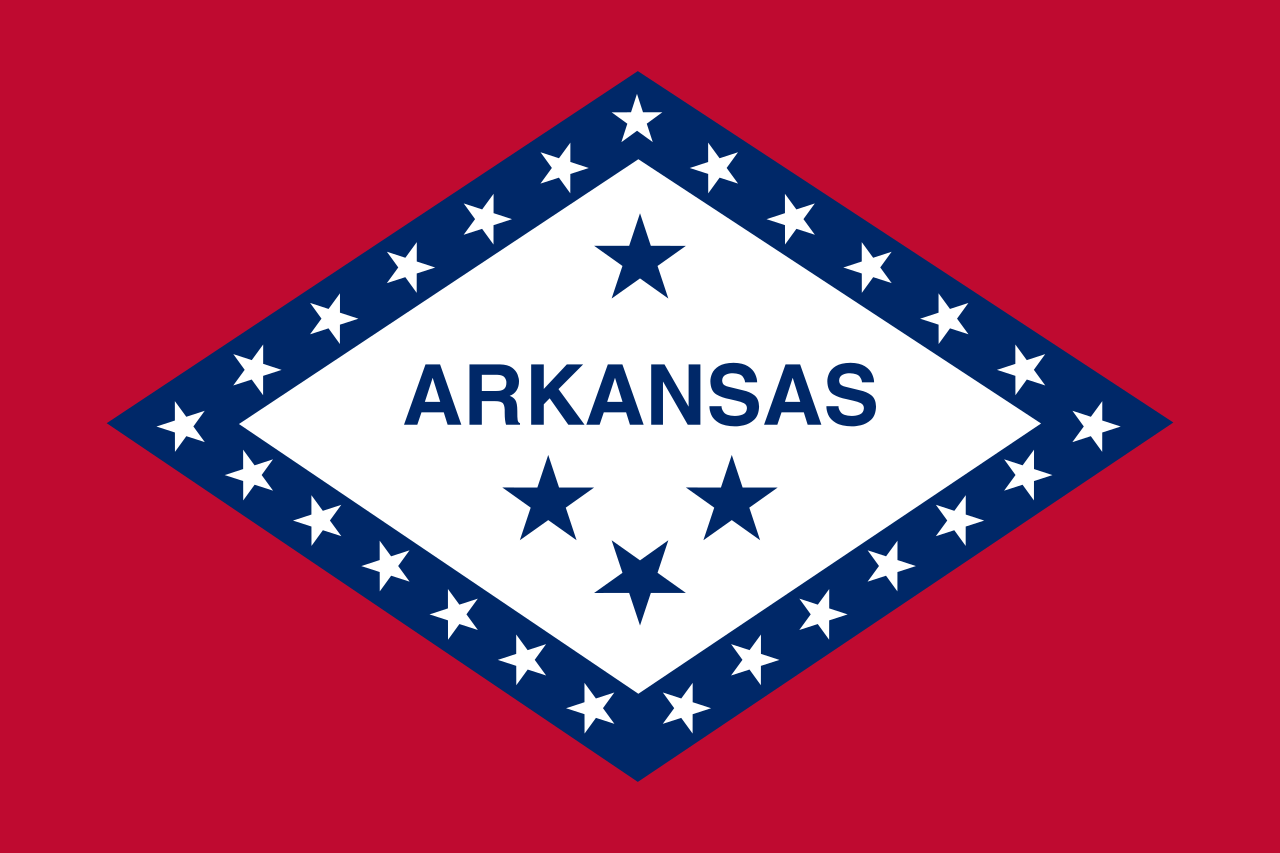 Arkansas-AR

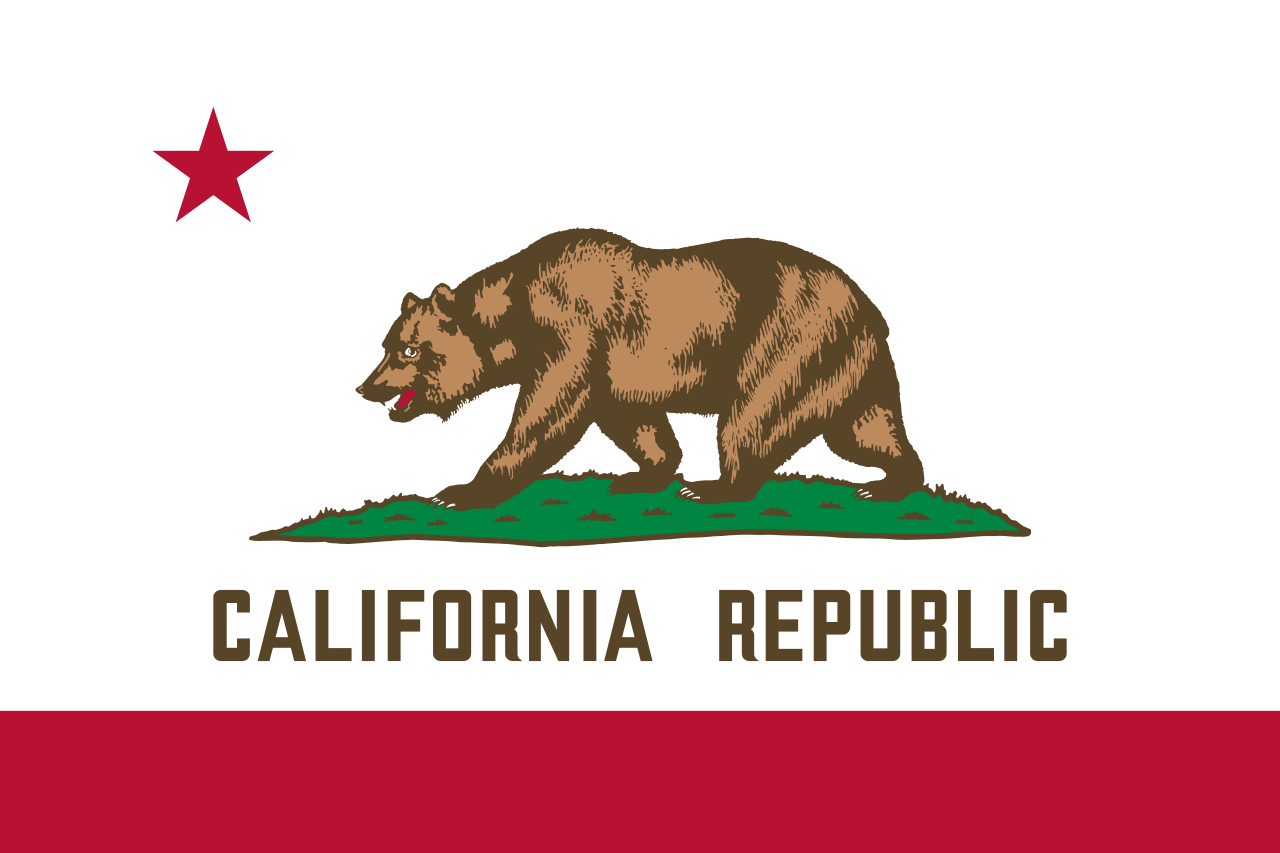 California-CA

 Colorado-CO

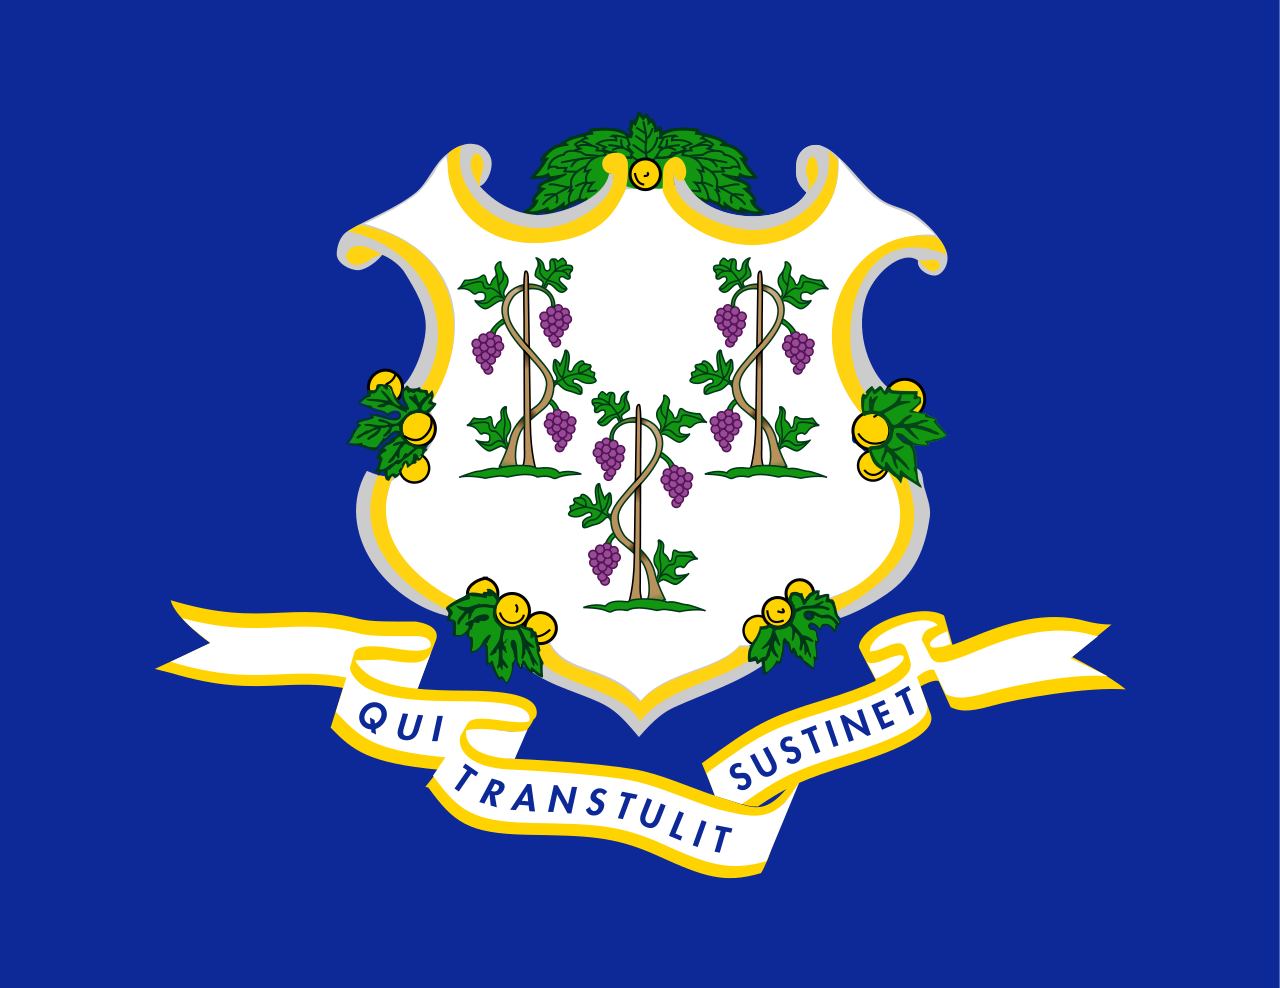 Connecticut-CT

 Energy resource

 Energy resource
 *Electrical power

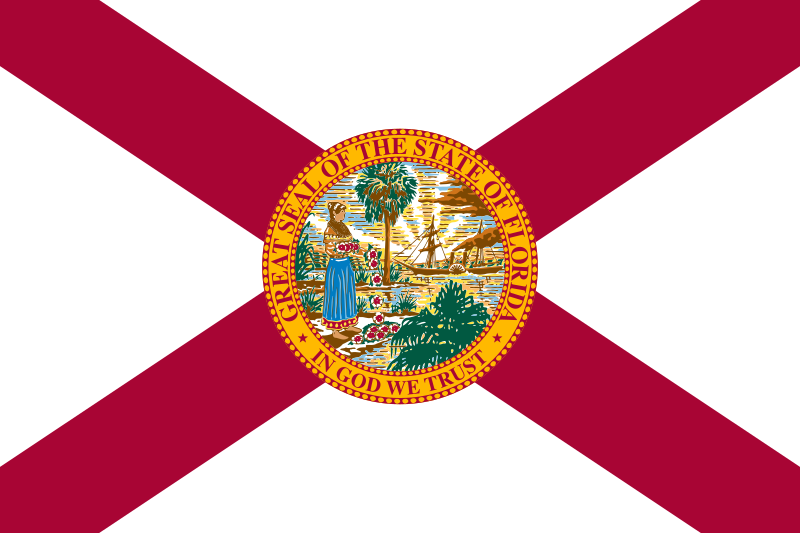 Florida-FL

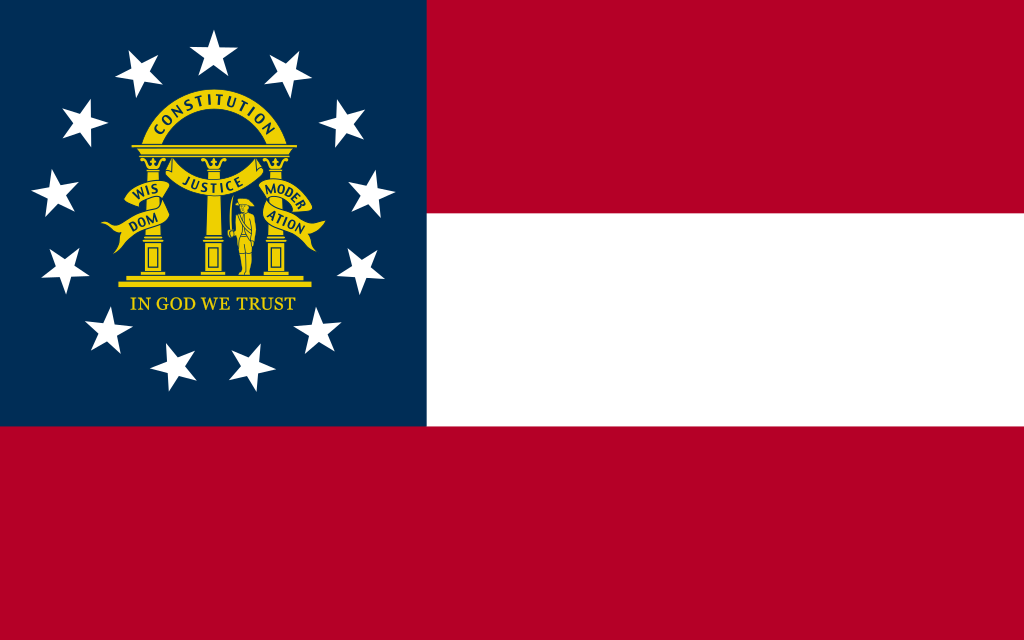 Georgia-GA

 Hawaii-HI

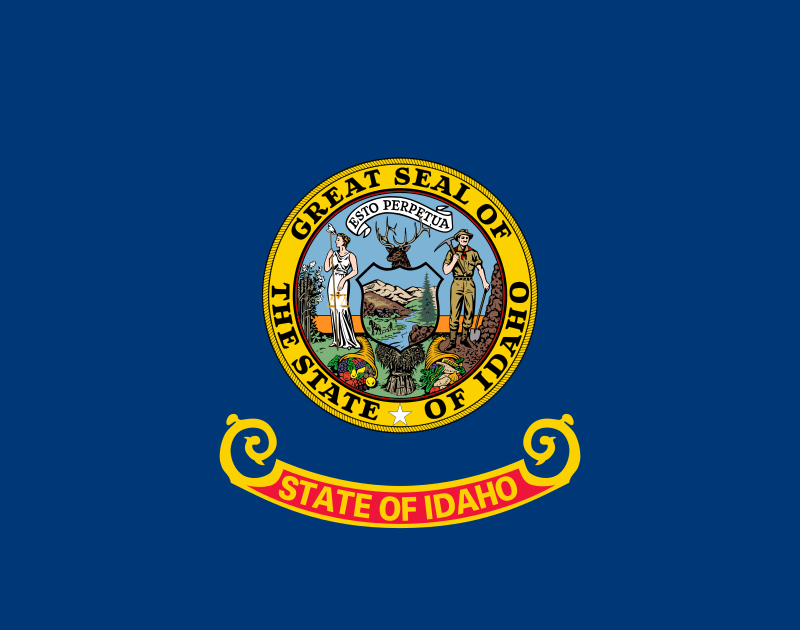 Idaho-ID

 Indiana-IN

 Iowa-IA

 Kentucky-KY

 Louisiana-LA

 Maine-ME

 Maryland-MD

 Massachusetts-MA

 Michigan-MI

 Minnesota-MN

 Montana-MT

 New hampshire-NH

 New jersey-NJ

 New York-NY

 North Carolina-NC

 Oklahoma-OK

 Oregon-OR

 Pennsylvania-PA

 South Carolina-SC

 Texas-TX
 United States

 Vermont-VT

 Virginia-VA

 Washington-WA

 Wisconsin-WI

| Last Modified on November 21, 2022 *Capacity noted in (MW) |
| Plant | Location | Feedstock | Capacity |
|---|---|---|---|
| Agrilectric Power Partners Ltd. | LA | Rice hulls | 12.00 |
| Albany Green Energy | GA | Forest residue, urban wood waste, pecan shells, peanut hulls | 50.00 |
| Allendale Biomass | SC | Mill/forestry residue | 20.00 |
| Altavista Power Station | VA | Woody biomass | 51.00 |
| Arnold O. Chantland Incineration Plant | IA | MSW/Refused-derived fuel (RDF) | 4.00 |
| Barron County Waste-to-Energy & Recycling Facility | WI | MSW | 2.00 |
| Bay Front Power Plant | WI | Wood waste | 56.00 |
| Biomass One | OR | Logging/wood debris | 30.00 |
| Bridgewater Power LP | NH | Woody biomass | 20.00 |
| Buckeye Florida Biomass | FL | Wood waste, black liquor | 69.40 |
| Burgess BioPower | NH | Wood waste | 75.00 |
| Burney Forest Power | CA | Wood waste | 31.00 |
| Cadillac Renewable Energy | MI | Forest residue | 40.00 |
| City of Spokane Waste to Energy Facility | WA | MSW | 22.00 |
| Collins Pine Co. Power Plant | CA | Forest thinnings/residue | 12.00 |
| Covanta Alexandria | VA | MSW | 22.00 |
| Covanta Babylon | NY | MSW | 17.00 |
| Covanta Bristol | CT | MSW | 16.00 |
| Covanta Camden | NJ | MSW | 21.00 |
| Covanta Dade | FL | MSW, wood waste | 77.00 |
| Covanta Delaware Valley | PA | MSW | 87.00 |
| Covanta Essex | NJ | MSW | 66.00 |
| Covanta Fairfax | VA | MSW | 93.00 |
| Covanta Harrisburg | PA | MSW | 21.00 |
| Covanta Haverhill | MA | MSW | 45.00 |
| Covanta Hempstead | NY | MSW | 72.00 |
| Covanta Hillsborough | FL | MSW | 47.00 |
| Covanta Honolulu | HI | MSW | 90.00 |
| Covanta Huntington | NY | MSW | 24.00 |
| Covanta Indianapolis | IN | MSW | 6.50 |
| Covanta Kent | MI | MSW | 17.00 |
| Covanta Lake | FL | MSW | 15.00 |
| Covanta Lancaster | PA | MSW | 33.00 |
| Covanta Lee | FL | MSW | 57.00 |
| Covanta Long Beach | CA | MSW | 36.00 |
| Covanta MacArthur | NY | MSW | 12.00 |
| Covanta Marion | OR | MSW | 13.00 |
| Covanta Montgomery | MD | MSW | 63.00 |
| Covanta Niagara | NY | MSW | 50.00 |
| Covanta Onondaga | NY | MSW | 39.00 |
| Covanta Palm Beach Renewable Energy #1 | FL | MSW | 62.00 |
| Covanta Palm Beach Renewable Energy #2 | FL | MSW | 95.00 |
| Covanta Pasco | FL | MSW | 30.00 |
| Covanta Pinellas | FL | MSW | 75.00 |
| Covanta Plymouth | PA | MSW | 32.00 |
| Covanta SECONN | CT | MSW | 17.00 |
| Covanta SEMASS | MA | MSW | 78.00 |
| Covanta Stanislaus | CA | MSW | 22.00 |
| Covanta Tulsa | OK | MSW | 17.00 |
| Covanta Union | NJ | MSW | 42.00 |
| Covanta York | PA | MSW | 42.00 |
| Cox Waste-to-Energy | KY | Wood waste | 5.00 |
| Craven County Wood Energy | NC | Wood chips, forestry residue, mill waste, bark, sawdust, poultry litter | 50.00 |
| Deerhaven Renewable Generating Station | FL | Wood waste | 102.50 |
| Desert View Power | CA | Woody biomass | 45.00 |
| DG Fairhaven Power | CA | Wood waste | 18.00 |
| Dillard Complex Cogeneration Plant | OR | Mill residue | 51.50 |
| Dorchester Biomass | SC | Mill/forestry residue | 20.00 |
| Douglas County Forest Products | OR | Wood residue | 6.00 |
| DTE Stockton Biomass Power | CA | Woody biomass, ag residue | 45.00 |
| Eagle Valley Clean Energy | CO | Forest restoration thinnings/residue | 12.00 |
| Ecomaine Waste-to-Energy Plant | ME | MSW | 14.00 |
| Evergreen Biopower LLC | OR | Mill residue | 10.00 |
| Fernandina Biomass Plant | FL | Mill residuals | 22.50 |
| French Island Generating Station | WI | MSW/RDF, wood waste, railroad ties | 28.00 |
| Genesee Power Station | MI | Landscaping/storm debris, waste wood | 40.00 |
| Grayling Generating Station | MI | Forestry residue, mill waste, bark | 38.00 |
| Green Energy Team LLC | HI | Eucalyptus, albizia | 7.50 |
| GRP-Franklin LLC | GA | C&D waste | 65.00 |
| GRP-Madison LLC | GA | C&D waste | 65.00 |
| Halifax County Biomass Plant | VA | Logging waste, forest slash | 49.90 |
| Hennepin Energy Recovery Center | MN | MSW | 40.00 |
| Hillman Power LLC | MI | Wood waste | 20.00 |
| Honey Lake Power | CA | High-hazard forest material/thinnings | 30.00 |
| Hopewell Power Station | VA | Woody biomass | 51.00 |
| Joseph C McNeil Generating Station | VT | Logging residue, bark, shavings, clean urban wood waste | 50.00 |
| Kapstone Kraft Paper Corp.-Longview | WA | Mill residue, wood waste | 25.00 |
| Kettle Falls Generating Station | WA | Logging/mill residue | 53.00 |
| Koda Energy LLC | MN | Oat/rice hulls, corn, barley and malt screening, urban tree waste | 23.40 |
| L'Anse Warden Electric Company | MI | Wood waste, railroad ties | 20.00 |
| M.L. Hibbard Energy Center | MN | Wood waste | 72.80 |
| Macon Mill | GA | Logging waste | 38.00 |
| McKay Bay Refuse-to-Energy Plant | FL | MSW | 22.00 |
| McKinley Paper Cogeneration Facility | WA | Logging/mill residue | 9.50 |
| Merced Power | CA | Ag waste | 12.50 |
| MMWAC Resource Recovery Facility | ME | MSW | 5.00 |
| Mt. Poso Cogeneration Co. LLC | CA | Wood waste | 44.00 |
| Multitrade Rabun Gap | GA | Woody biomass | 18.00 |
| National Energy-Lincoln | MI | Wood waste | 18.00 |
| National Energy-McBain | MI | Wood waste | 18.00 |
| North Carolina Renewable Power | NC | C&D waste, wood waste, poultry litter | 22.00 |
| North Fork Community Power | CA | High-hazard forest material | 2.00 |
| Novo BioPower LLC | AZ | Wood waste | 27.00 |
| Okeelanta Biomass Cogeneration | FL | Baggasse, natural gas | 74.90 |
| Olmsted Waste-To-Energy Facility | MN | MSW | 9.60 |
| Oswego Energy Recovery Facility | NY | MSW | 4.00 |
| Pacific Ultrapower Chinese Station | CA | Woody biomass | 25.00 |
| Penobscot Energy Recovery | ME | MSW | 25.00 |
| Piedmont Green Power | GA | Urban wood waste, mill and logging residue | 55.00 |
| Plainfield Renewable Energy | CT | C&D/forestry waste | 37.50 |
| Plummer Cogen | ID | Wood waste | 6.20 |
| Potlatch Land & Lumber Power Plant | AR | Bark, sawdust, shavings | 10.00 |
| Rapids Energy Center | MN | Logging/mill residue | 28.60 |
| Red Wing Generating Station | MN | MSW/RDF | 22.00 |
| ReEnergy Black River | NY | Woody biomass | 60.00 |
| ReEnergy Livermore Falls | ME | Forest residue, C&D waste | 39.00 |
| ReEnergy Stratton | ME | Forest/mill residue | 48.00 |
| Resolute Forest Products Coosa Pines | AL | Wood-processing waste | 30.00 |
| Rio Bravo Fresno | CA | Ag/urban wood waste | 24.30 |
| Rio Bravo Rocklin | CA | High-hazard forest material, ag/urban waste | 24.40 |
| RockTenn-Tacoma Mill | WA | Mill residue | 55.00 |
| Roseburg Forest Products Biomass | CA | Wood waste | 13.00 |
| Rothschild Biomass Cogeneration Plant | WI | Urban wood waste, mill residue | 50.00 |
| Savannah River Site Biomass Cogeneration Facility | SC | Forest residue | 20.00 |
| Scotia Cogen | CA | Wood waste | 28.00 |
| SDS Lumber Gorge Energy Division | WA | Logging/mill residue | 10.00 |
| Shasta-Sustainable Resource Management | CA | Wood waste, forest residue | 56.00 |
| Southampton Power Station | VA | Woody biomass | 51.00 |
| Southern Co. Nacogdoches Generating Facility | TX | Forest/wood processing residue | 115.00 |
| SPI-Aberdeen Biomass Power | WA | Logging/mill residue | 18.00 |
| SPI-Anderson Biomass Power | CA | Logging/mill residue | 30.00 |
| SPI-Burlington Biomass Power | WA | Logging/mill residue | 28.00 |
| SPI-Burney | CA | Logging/mill residue | 20.00 |
| SPI-Eugene | OR | Mill, forest residue | 19.80 |
| SPI-Lincoln Biomass Power | CA | Logging/mill residue | 18.00 |
| SPI-Quincy Biomass Power | CA | Mill residue | 35.20 |
| SPI-Sonora Biomass Power | CA | Logging/mill residue | 10.90 |
| St. Paul Cogeneration LLC | MN | Urban wood residue | 33.00 |
| Stoltze Cogeneration Power Plant | MT | Mill residue | 3.00 |
| Stored Solar Bethlehem | NH | Logging residue, forest thinnings | 20.00 |
| Stored Solar Fitchburg | MA | Woody biomass | 17.00 |
| Stored Solar Jonesboro | ME | Woody biomass | 25.00 |
| Stored Solar Ryegate | VT | Woody biomass | 20.00 |
| Stored Solar Springfield | NH | Woody biomass | 19.00 |
| Stored Solar Tamworth | NH | Woody biomass | 20.00 |
| Stored Solar West Enfield | ME | Woody biomass | 25.00 |
| Stored Solar Whitefield | NH | Woody biomass | 15.00 |
| Telogia Power | FL | Logging/mill residue, hog fuel, peanut hulls | 14.00 |
| U.S. Sugar Corp. Cogeneration Plant | FL | Bagasse | 50.00 |
| Virginia City Hybrid Energy Center | VA | *Woody biomass | 120.00 |
| Wadham Energy LP | CA | Rice hulls | 30.00 |
| Westervelt Renewable Energy Moundville | AL | Wood waste | 13.00 |
| WestRock Covington | VA | Logging, papermaking residue | 75.00 |
| Wheelabrator Baltimore | MD | MSW | 64.50 |
| Wheelabrator Bridgeport | CT | MSW | 67.00 |
| Wheelabrator Concord | NH | MSW | 14.00 |
| Wheelabrator Dutchess County | NY | MSW | 9.00 |
| Wheelabrator Falls | PA | MSW | 53.00 |
| Wheelabrator Gloucester | NJ | MSW | 14.00 |
| Wheelabrator Hudson Falls | NY | MSW | 14.00 |
| Wheelabrator Lisbon | CT | MSW | 15.00 |
| Wheelabrator Millbury | MA | MSW | 48.00 |
| Wheelabrator North Andover | MA | MSW | 40.00 |
| Wheelabrator Portsmouth | VA | MSW | 60.00 |
| Wheelabrator Saugus | MA | MSW | 54.00 |
| Wheelabrator South Broward | FL | MSW | 66.00 |
| Wheelabrator Westchester LP | NY | MSW | 60.00 |
| Wilmarth Generating Station | MN | MSW/RDF, woody biomass | 18.00 |
| Woodland Biomass Power | CA | Wood chips, urban wood waste, ag waste | 25.00 |
| Total Plants: 159 | Total capacity(MW): | 5,583.90 |
 *United States Political System

 Financial
 *United States economic data
 United States Department of Energy
 Advanced Research Projects Agency-Energy
 United States Department of Energy
 Bonneville Power Administration
 United States Department of Energy
 Credit Review Board
 United States Department of Energy
 Energy Council
 United States Department of Energy
 Energy Systems Acquisition Advisory Board,ESAAB
 United States Department of Energy
 Federal Energy Regulatory Commission
 United States Department of Energy
 National Laboratory Policy Council
 United States Department of Energy
 National Nuclear Security Administration,NNSA
 United States Department of Energy
 Nuclear Security Council
 United States Department of Energy
 Office of Inspector General
 United States Department of Energy
 Office of Under Secretary for Management and Performance
 United States Department of Energy
 Office of Under Secretary for Science and Energy
 United States Department of Energy
 Secretary
 United States Department of Energy
 Secretary of Energy Advisory Board
 United States Department of Energy
 Southeastern Power Administration
 United States Department of Energy
 Southwestern Power Administration
 United States Department of Energy
 U.S. Energy Information Administration
 United States Department of Energy
 United States Department of Energy national laboratories
 United States Department of Energy
 Western Area Power Administration

 Washington, D.C.


A college endowment refers to all the money that an institution receives in donations. However, endowment funds are not ‘no-questions-asked’ cash boosts for the college. Instead, endowments are tightly controlled investments that are supposed to be grown so that the interest can be used to upgrade facilities, hire new staff, provide scholarships or aid the college or its students in some way.
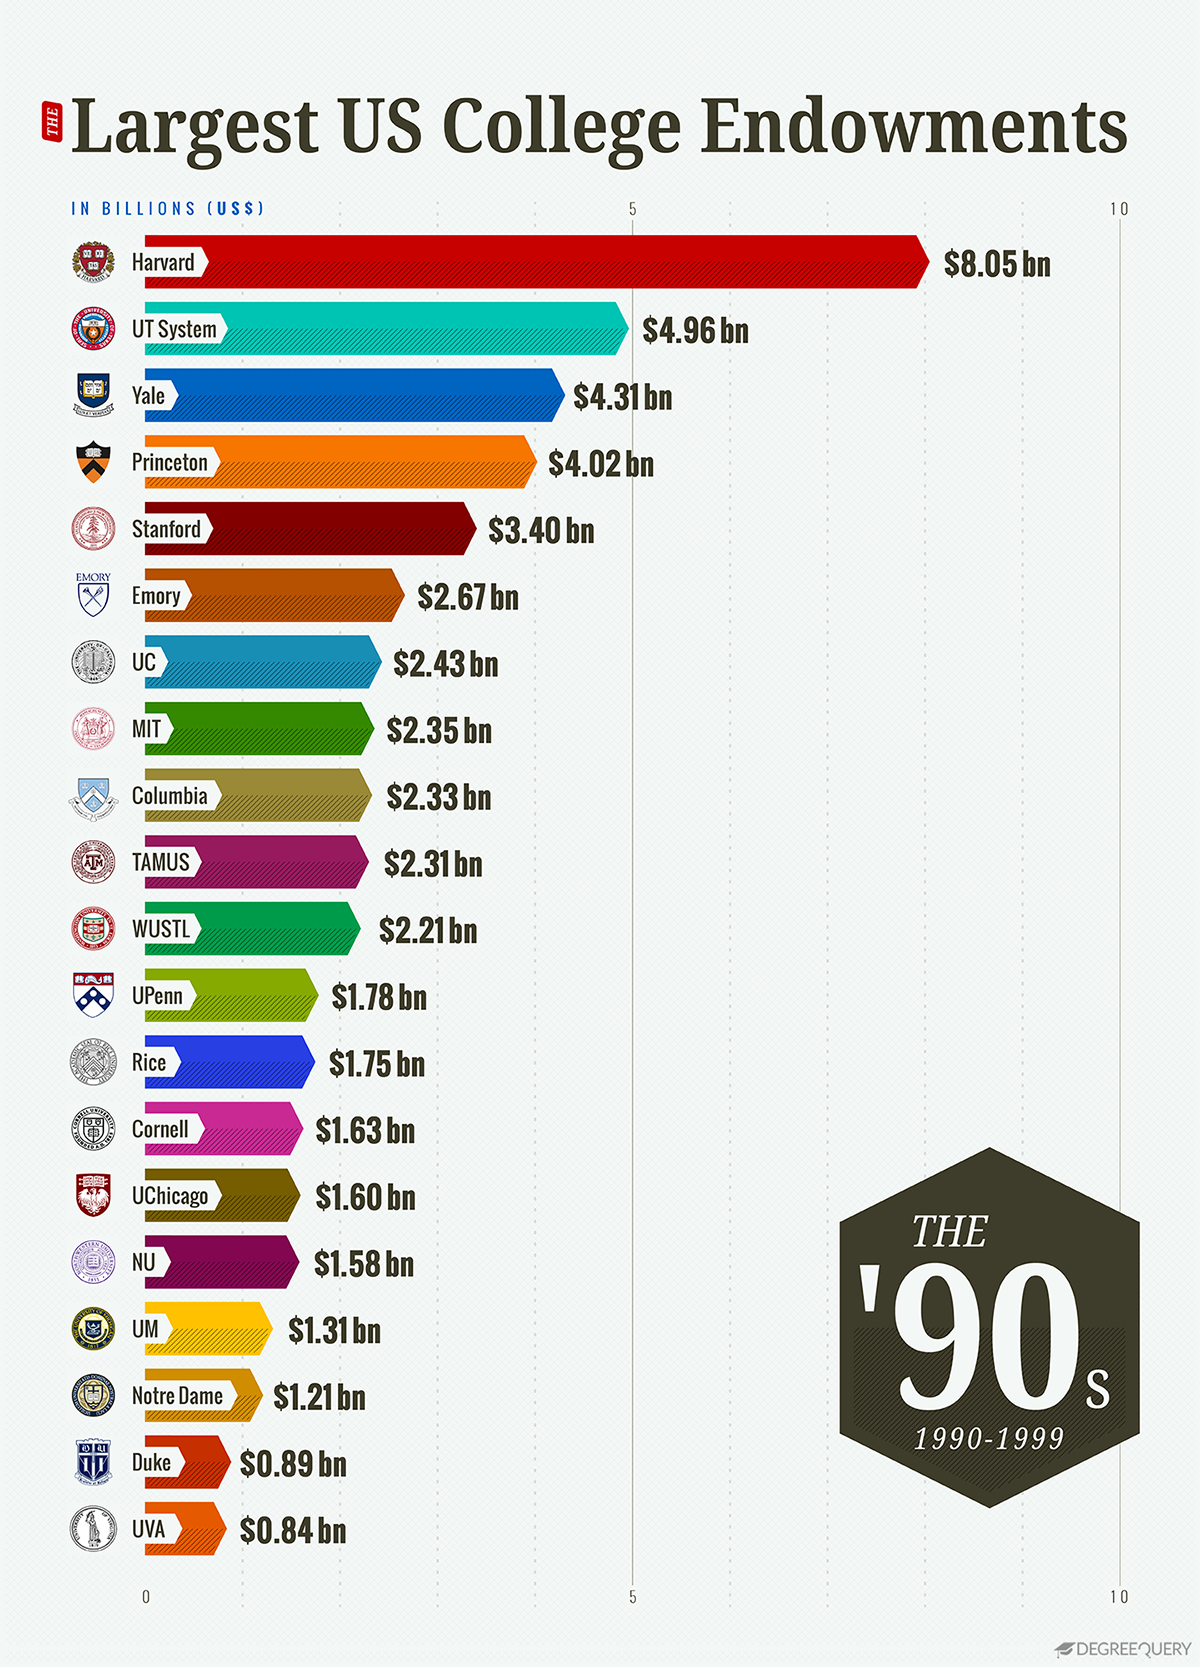
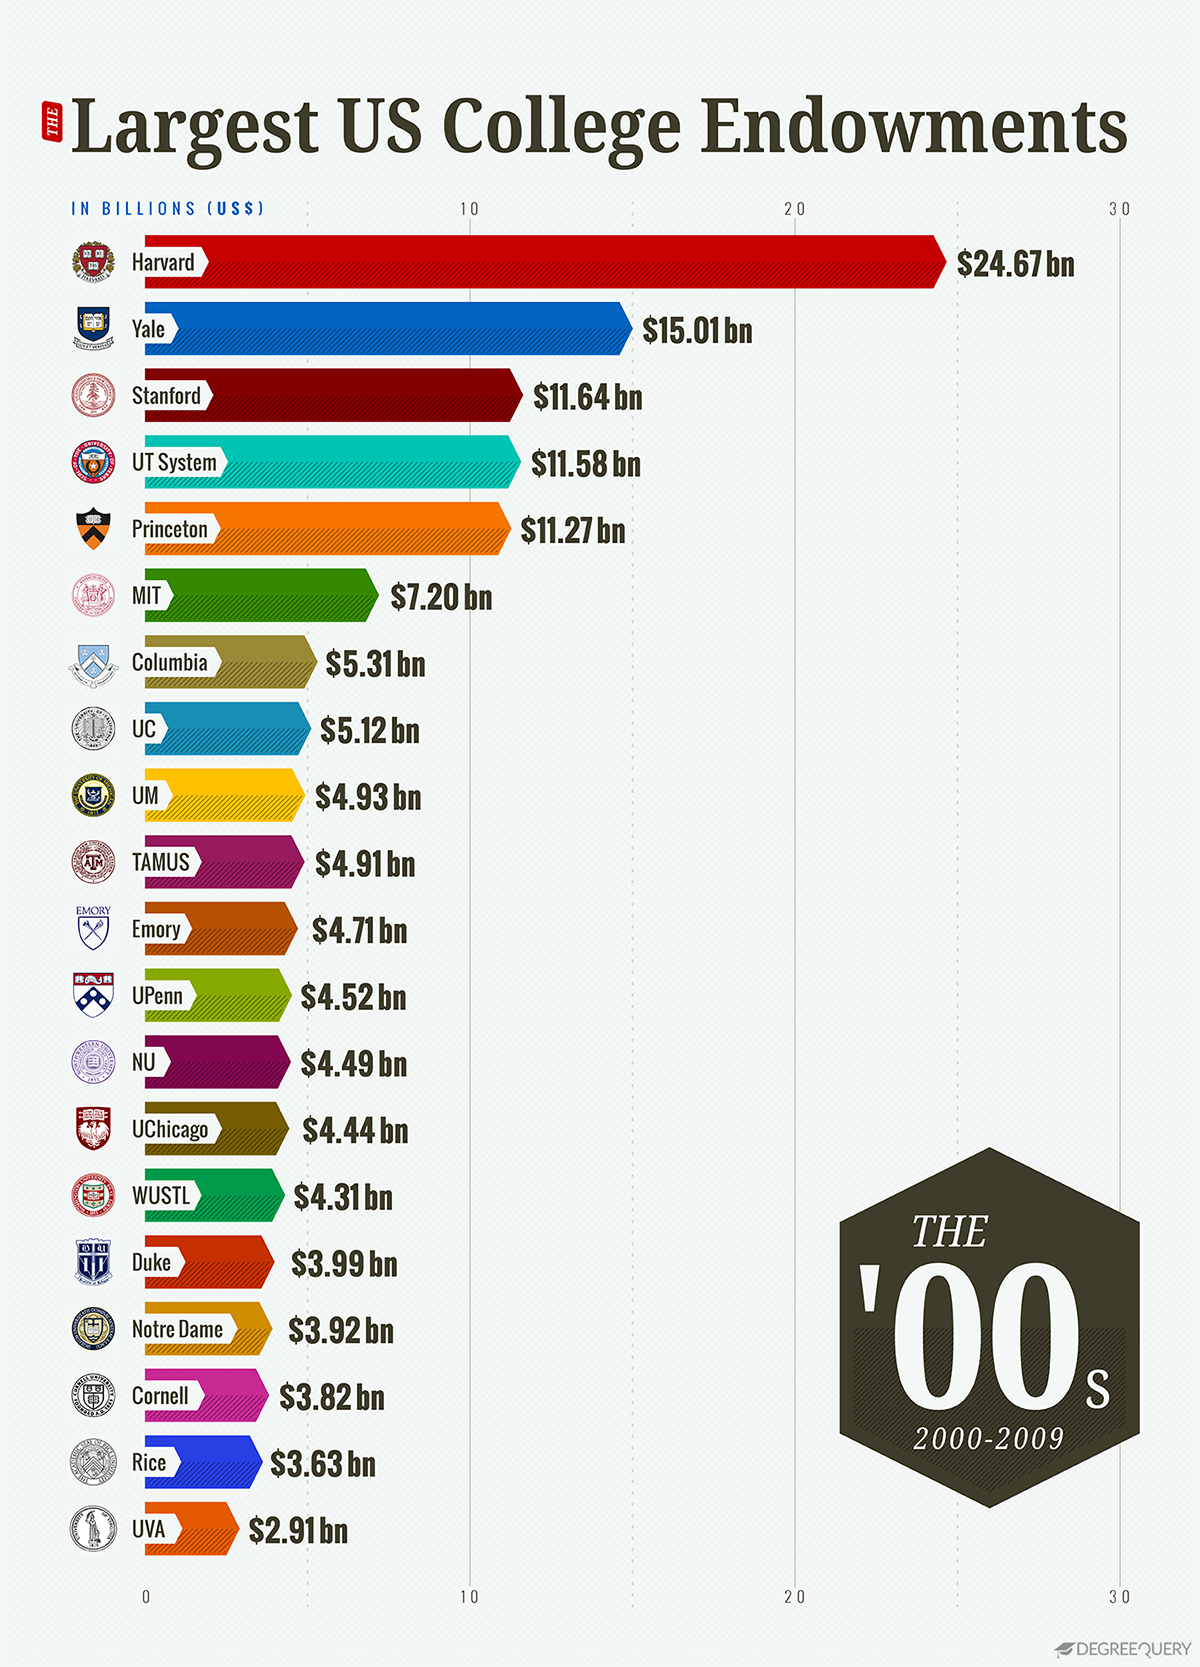
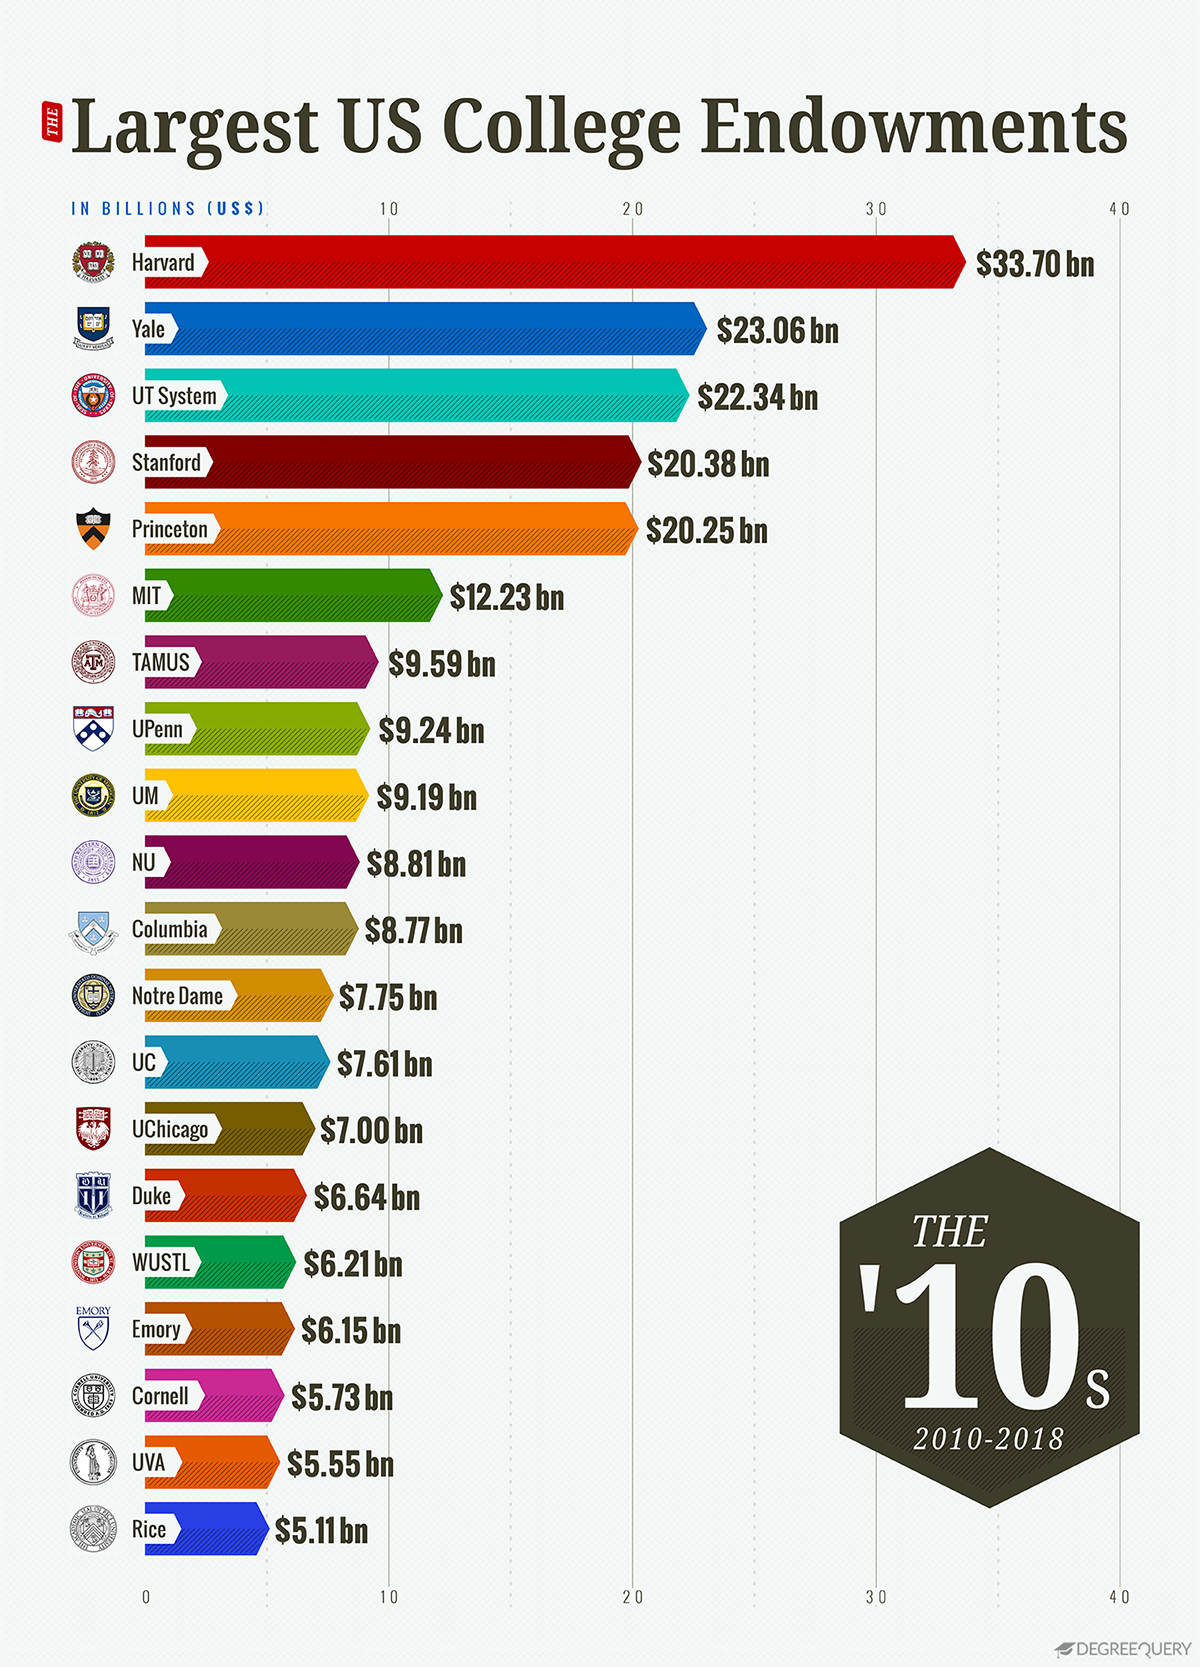
Over the past three decades, the total market value of the 20 largest college endowments has grown nearly tenfold — from $30.6 billion to $302.1 billion. As the size of college endowments has increased, so too has the debate over their purpose, management and ethical obligations.
To get a better idea of how college endowments have changed over the last 30 years, DegreeQuery looked at the market value of the 20 largest U.S. college endowments from 1990 to 2020.
30 Years of U.S. college endowments
Based on the most recent NACUBO survey of 810 universities, the total market value of endowments in 2018 was $624.3 billion. 48.3% of that is held by just 20 colleges. But why the huge growth in market value over the past 30 years? It might be something to do with how much of the endowment the university chooses to spend on operations or the return rates of the endowment’s investment portfolio. Due to their often wealthy donor base and long-term investment horizons, the largest university endowments can invest in a diverse array of asset classes, and often grow faster than the economy as a whole.
From 1990 to 2020, the market value of the 20 largest college endowments grew at an average annual rate of 8.5% — faster than the 6.6% average annual growth rate for the Fortune 500 over the same period. The universities with the fastest growth over the past 30 years include the University of Michigan, Duke University and the University of Notre Dame. Meanwhile, the endowments with the slowest growth include Emory University, Rice University and Washington University in St. Louis.
1. U.S. college endowments in the 1990s
From 1990 to 1999, the market value of the 20 largest U.S. college endowments grew at an average annual rate of 12.5% — the fastest of the last three decades. As you can see from our graph, over this period, the University of Michigan endowment rose from the 20th largest to the 17th largest, and the University of Pennsylvania rose from the 16th largest to the 12th largest. Meanwhile, the Columbia University endowment fell from the sixth-largest to the 11th largest. Although the University of Texas System endowment had the slowest growth of the 20 largest endowments over this period, it remained the second-largest endowment overall.
2. U.S. college endowments in the 2000s
Endowment growth is closely connected with the overall health of the economy. As of 2018, just 4% of endowment assets were held as cash, the rest invested in equities, fixed income instruments and alternative investment vehicles. In the lead up to the 2008 financial crisis — university endowments had increasingly invested in high-risk, illiquid investments like private equity, real estate and hedge funds. As a result, endowments lost tens of billions of dollars in value, with some schools losing more than 25% of their total endowment value. From 2008 to 2009, the total value of the 20 largest endowments fell 3.4%. Yale posted the largest percentage decline, losing 28.6% of its market value. Other university endowments that posted big losses from the recession include Harvard, Duke and Stanford.
3. U.S. college endowments in the 2010s
Endowment growth rates rebounded in the wake of the Great Recession, although growth was still slow compared to the 1990s. From 2010 to 2018, the market value of the 20 largest endowments grew at an average annual rate of 7.6%. This is more than the 3.5% average annual growth rate for 2000 to 2009, yet less than the 12.5% rate for 1990 to 1999. During this period, the biggest winners were the University of Pennsylvania, rising from 11th to 7th largest, and the Texas A&M University System, which rose from 10th to 8th largest. Lackluster performance at some of the wealthiest schools has prompted some universities to make major changes to their endowment management. In 2017, for example, Harvard announced it would lay off roughly half of its 230-person staff in the wake of poor investment performance.
As you can see, university endowments were big business over the past 30 years. Nowadays, students, policymakers and the general public are increasingly involved in the conversation surrounding their management, mission and societal impact. For example, the 2017 Tax Cuts and Jobs Act, which imposed a 1.4% tax on the net investment income of the wealthiest endowments, recently sparked a wave of criticism from university administrators. Elsewhere on campus, protesting students demanded their universities divest from fossil fuel companies.
As the debate rages on and endowments continue to grow, these visualizations help us see how we got to this point.
Methodology
To get a better idea of how college endowments have changed over the last 30 years, DegreeQuery looked at the market value of the 20 largest U.S. college endowments from 1990 to 2018. Data on endowment asset value by university came from the National Association of College and University Business Officers (NACUBO) and is unadjusted for inflation. In years when certain universities did not participate in the NACUBO survey, we estimated the endowment value based on the compound annual growth rate for all available years. Estimated figures include the market value of the endowment assets for the Texas A&M University System for 1990, as well as the market value of the endowment assets for the University of California system for the years 1990 through 1992.
SOURCES
Fortune 500. (n.d.) Fortune 500 2018. fortune.com
NACUBO. (2019). Detailed Asset Allocations for U.S. College and University Endowments and Affiliated Foundations, FY18. nacubo.org
Miller, C. & Fabrikant, G. (2008). Universities retrench as endowments suffer from financial crisis. nytimes.com
Humphreys, J. et al. (2010). Educational Endowments and the Financial Crisis: Social Costs and Systemic Risks in the Shadow Banking System. tellus.org
Plender, J. (2014). There is a history lesson to be learnt from Yale endowment. ft.com
Fabrikant, G. (2017). Harvard Makes Changes in Managing a Lagging Endowment. nytimes.com
Tax Policy Center. (n.d.). What is the tax treatment of college and university endowments? taxpolicycenter.org


联邦储备系统(英语:Federal Reserve System, Fed),全称美国联邦储备系统(美联储),也称美国联邦储备理事会(联储会),是美国的中央银行体系。由美国国会通过1913年的《联邦储备法案》而创设,以避免再度发生类似1907年的银行危机。
联邦储备系统包括:“联邦储备系统理事会”(Board of Governors of the Federal Reserve System)、“联邦公开市场委员会”(Federal Open Market Committee)、“联邦储备银行” (Federal Reserve Banks)、约三千家会员银行、及三个咨询委员会(Advisory Councils)。美国联邦储备系统是以私有形式组织的行使公共目的的私营银行系统。美国政府虽不拥有美联储的股份,但美联储的94%利润(2009年 总利润为450亿美元)转交给美国财政部,剩余6%用于给会员银行发放股息;同时,美国政府任命美联储的所有高级雇员。本·伯南克(Ben Shalom Bernanke)为现任美联储理事会主席。


 Bark
Bark
 Three-masted barque

 Connecticut-CT


 Military, defense and equipment
 Segelschiff
 Three-masted barque
 Segelschiff
 Bark/Barque/Barc
 United States

 United States history
 Legend
 Linienschiff
 Dreimast

 Massachusetts-MA


 Military, defense and equipment
 *Ship of the line

 Ships and Nautics
 Sailing ship
 Segelschiff
 Full rigged ship
 United States Navy
 United States

宪法号护卫舰(英语:USS Constitution,舷号IX-21)是美国海军创立时建造的首批军舰之一,也是目前美国海军舰龄最长的现役军舰。她是根据美国战争部长蒂莫西·皮克林草拟的命名指引命名,纪念美国宪法。
宪法号在1794年动工建造,并在1797年下水服役,随即参与美法准战争和第一次巴巴里战争,保护遭受私掠的美国商船。1812年战争初期,宪法号立下显赫战功,先后在三场海战单独击毁或俘获四艘英国皇家海军军舰,且没有受到严重伤害。这为宪法号赢得“老铁壳”(Old Ironsides)的称号。
1812年战争结束后,宪法号曾经派驻地中海和太平洋地区,并且在1843年进行环球航行。随着风帆战列舰逐渐落伍,宪法号在1855年改装为非战斗军舰,直至1881年退役为止。由于宪法号舰体严重腐朽,维修费用高昂,海军曾经考虑将宪法号用作靶舰击沉,但消息曝光后引起美国公众强烈反弹。经过数次公众筹款和义卖,宪法号先在1907年改为博物馆舰,再在1925年进入船坞全面翻修。1931年宪法号重新服役,并持续至今。
宪法号自1934年起就在波士顿对外开放。目前宪法号停泊于旧查尔斯顿海军造船厂,也是“自由之路”的地标之一。宪法号本身仍由美国海军管理,而附近的宪法号博物馆(1976年开幕)则由私人机构运营。
宪法号是十九世纪美国独立战争时期最有名的一艘战舰,它被美国海军视为拼搏和胜利的象征。
宪法号美国海军史上最有名的风帆快速护卫舰。该舰总长62米,宽13 米,型深6 米,排水量2200 吨,帆面积3969 平方米,装备28 门24 磅和10 门12 磅火炮,船员400 人,于1797 年10 月21 日在波士顿下水。在美国独立战争期间,该舰曾参加40 多次海战,在一对一的战舰较量中更屡屡获胜,因而成为海军拼搏和胜利的象征。
Die USS Constitution (englisch für Verfassung) ist eine hölzerne schwere Fregatte der United States Navy. Sie ist das älteste noch seetüchtige Kriegsschiff der Welt und nach der HMS Victory das zweitälteste, das noch in Dienst steht. Ihr Spitzname Old Ironsides geht auf das Gefecht mit der britischen Fregatte Guerriere im Jahre 1812 zurück, weil Geschosse dieses Schiffs an den starken Bordwänden der Constitution abgeprallt sein sollen. Ihre lange aktive Dienstzeit, der Umstand, dass sie nie besiegt wurde, vor allem aber drei erfolgreiche Gefechte der Constitution gegen britische Kriegsschiffe im Krieg von 1812 begründeten die große nationale Bedeutung der Fregatte für die Vereinigten Staaten. Zudem leisteten zahlreiche ihrer Kommandanten und Besatzungsmitglieder wie Stephen Decatur, Isaac Hull, William Bainbridge u. a. in späterer Folge einen namhaften Beitrag beim Aufbau der US Navy. Auch im britischen maritimen Diskurs spielten die unerwarteten Niederlagen gegen die Constitution und ihre Schwesterschiffe eine Rolle.

 Universities in the USA
 Law
Law
 Economy and trade

 Dances
 Performing Arts
 Mississippi-MS
 Music
Music
 History
 Architecture
 Utah-UT